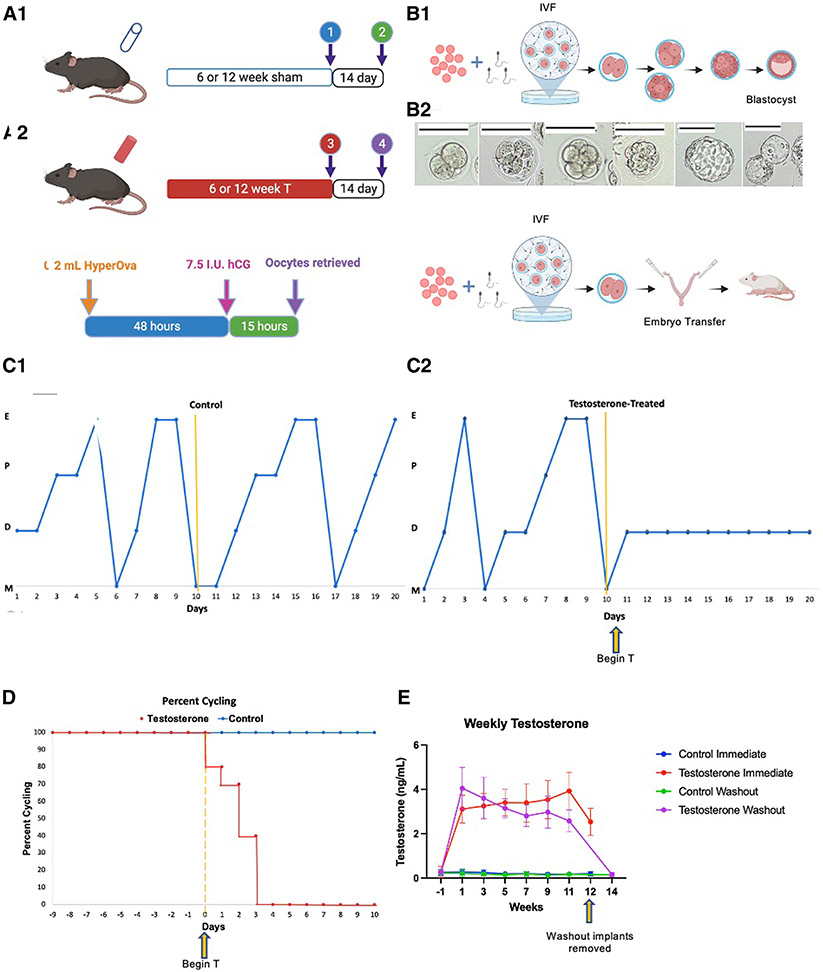
FIGURE 1. Experimental design and model profile.
(A1) Control or T silastic tubing implants placed subcutaneously for 6 or 12 weeks representing short and long-term treatment cohorts. For immediate groups, implants remained in place at time of IVF while in cessation groups implants were removed with a 14 day washout period before IVF. (A2) Ovarian stimulation protocol utilized for all mice. (B) Embryo culture design with (B1) arm cultured to blastocyst stage and (B2) cultured to 2-cell embryo stage with subsequent transfer into pseudopregnant mice. (C1) Cyclicity of one representative control and (C2) one representative T-treated mouse. (D) Percent cyclicity for mice after implant placement in control and T cohorts. (E) Weekly T levels obtained prior to implant placement then biweekly throughout study duration for all treatment cohorts.
hCG, human chorionic gonadotropin; IVF, in vitro fertilization; T, testosterone.

