Figure 10.

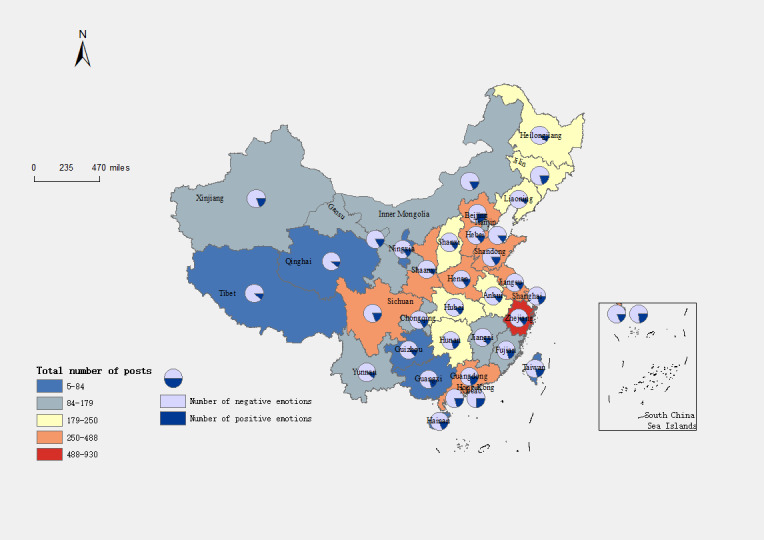
Number of blog posts and daily attention regarding influenza A in different provinces. The pie charts show the distribution of sentiment orientation in each area.

Number of blog posts and daily attention regarding influenza A in different provinces. The pie charts show the distribution of sentiment orientation in each area.