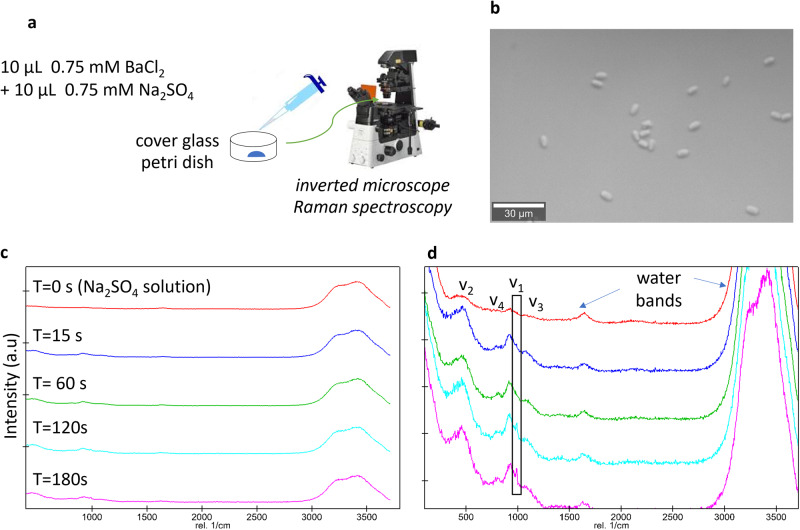
Fig. 1. Collection of datasets from the pseudo bulk experiment with SI(initial) = 2.8.
a Experimental setup; b optical micrograph of barite crystals after three minutes; c Raman spectra collected during the experiment; d zoom on the intensity of the SO42− signature bands with ν1 and ν3 corresponding to the symmetric and the anti-symmetric stretching mode respectively, and ν2 and ν4 corresponding to the bending vibrations3. The water bands indicated refer to the H-O-H bending mode at 1648 cm−1, and the symmetric and anti-symmetric O-H bands at 3280 and 3410 cm−1, respectively.

