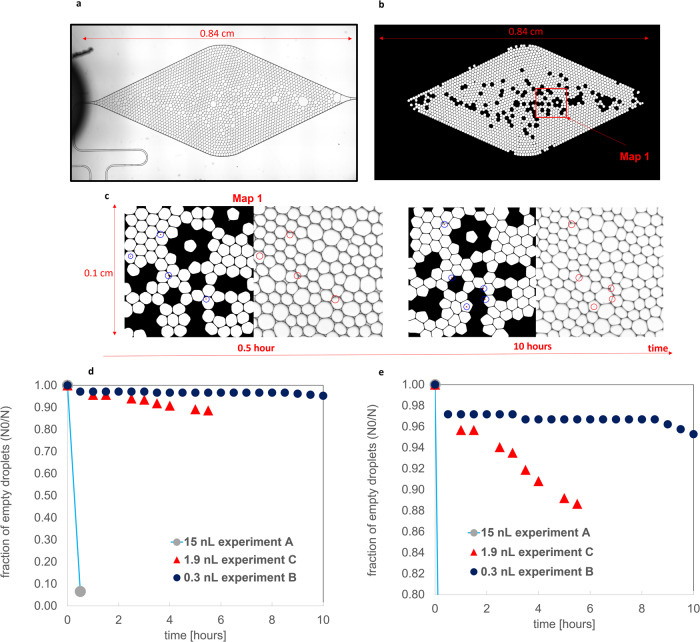
Fig. 3. Processing of image datasets from droplet microfluidic experiments to extract the probability of nucleation and the rate.
a Micrograph of the storage chip of experiment B after 30 min; b segmented image with droplets of larger or smaller volumes, resulting from instabilities in the flow, removed; c micrographs (right) and corresponding segmented images (left) of a sample location map after 0.5 and 10 h, respectively, with the red circles indicating the presence of crystallites; d graph showing the fraction of crystallite-free droplets as a function of reaction time for experiments A–C with e showing a change in the range of the y-axis to enhance visualization.

