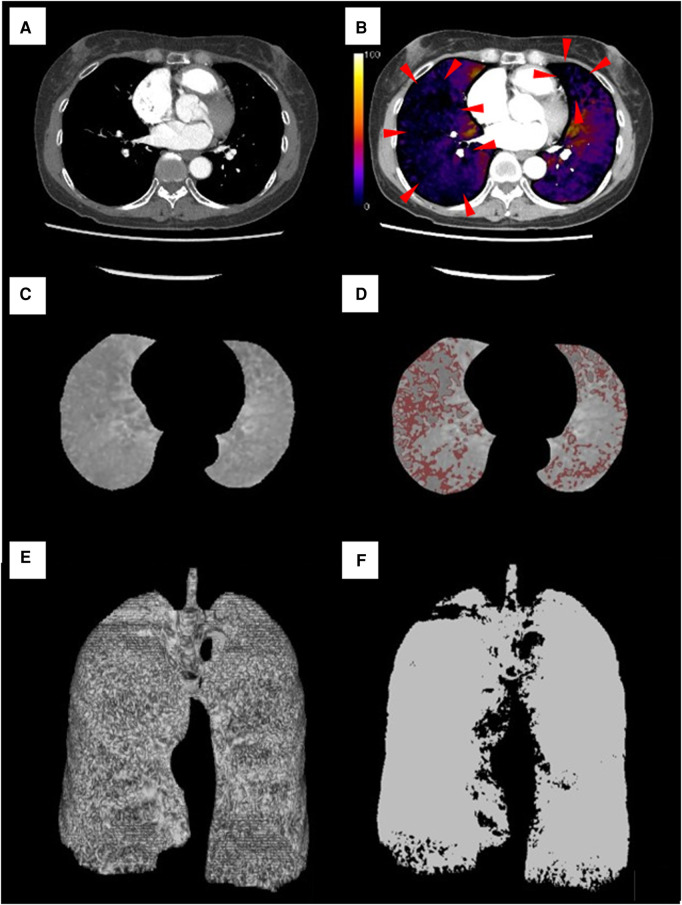
Figure 1.
Lung subtraction iodine mapping images in a representative case. A 57-year-old woman was diagnosed with chronic thromboembolic pulmonary hypertension with a severely high mean pulmonary arterial pressure of 53 mmHg and pulmonary vascular resistance of 10.5 Wood units. (A) Contrast-enhanced CT image of middle and lower lobe levels. (B) LSIM-CT image (color-coded iodine distribution maps of the lung parenchyma) at the same level as in image (A). Decreased pulmonary perfusion is presented in the image (red arrow). (C) The grayscale iodine map at the same level as in image (A). (D) DPA of 0–10 HU on the grayscale iodine map (areas with red color). (E) Three-dimensional image of the total lung obtained from the LSIM-CT image (3,469.91 mm3). (F) Three-dimensional image of DPA of 0–10 HU obtained from the LSIM-CT image (885.64 mm3). The volume of the area was automatically calculated using software as the accumulation of the voxels. The DPA ratio of 0–10 HU was calculated as 25.52%. DPA, decreased pulmonary perfusion area.

