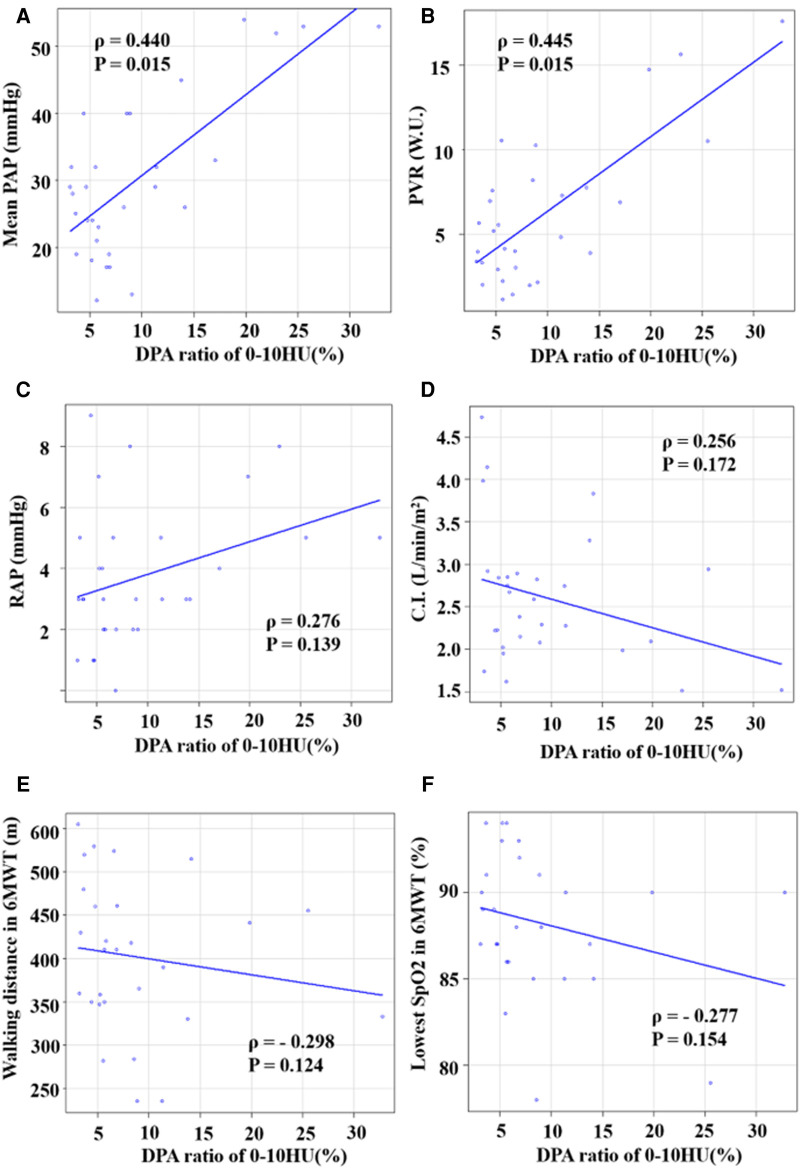
Figure 2.
Correlations between DPA ratio of 0–10 HU and hemodynamic parameters. (A) Correlation between DPA ratio of 0–10 HU and mPAP. (B) Correlation between DPA ratio of 0–10 HU and PVR. (C) Correlation between DPA ratio of 0–10 HU and RAP. (D) Correlation between DPA ratio of 0–10 HU and cardiac index (CI). (E) Correlation between DPA ratio of 0–10 HU and walking distance in the 6MWT. (F) Correlation between DPA ratio of 0–10 HU and lowest SpO2 in the 6MWT. DPA ratio, decreased pulmonary perfusion area to total lung volume ratio.

