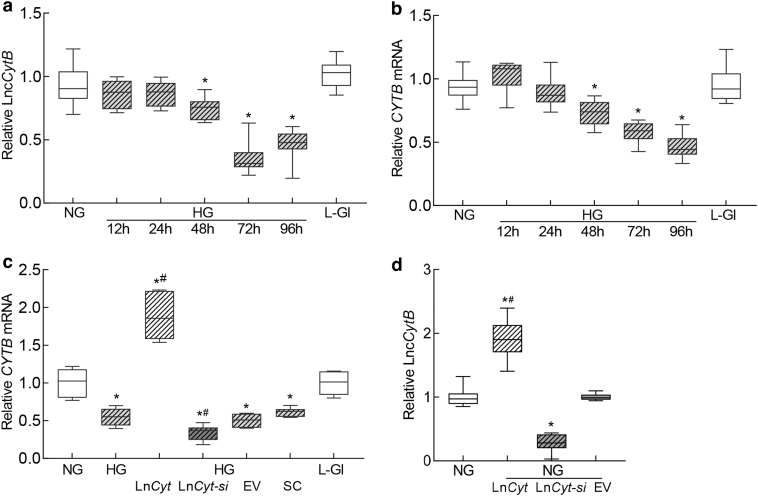
FIG. 1.
Temporal relationship between duration of high glucose exposure and expression of LncCytB and CYTB. HRECs incubated in high glucose for 12, 24, 48, 72, and 96 h were analyzed for (a) LncCytB transcripts by strand-specific PCR, and (b) CYTB mRNA by qRT-PCR using β-actin as a housekeeping gene. (c) Effect of LncCytB regulation on CYTB mRNA. (d) Transfection efficiency of LncCytB overexpression or si-RNA, quantified by its transcripts. Each measurement was performed in triplicate in five different cell preparations, and the values are represented as mean ± SD. LncCyt, LncCytB overexpressing plasmids; LncCyt-si, LncCytB-siRNA; NG and HG = 5 and 20 mM d-glucose; HG/LnCyt, HG/LnCyt-si, HG/EV, and HG/SC, cells transfected with LncCytB overexpressing plasmids, or LncCytB-siRNA, or empty vector or with scrambled control RNA, respectively, and incubated in high glucose for 96 h; L-Gl = 20 mM l-glucose; *p < 0.05 versus NG and #p < 0.05 versus HG. EV, empty vector; HG, high glucose; HREC, human retinal endothelial cell; NG, normal glucose; qRT-PCR, real-time quantitative polymerase chain reaction; SC, scrambled control RNA; SD, standard deviation.

