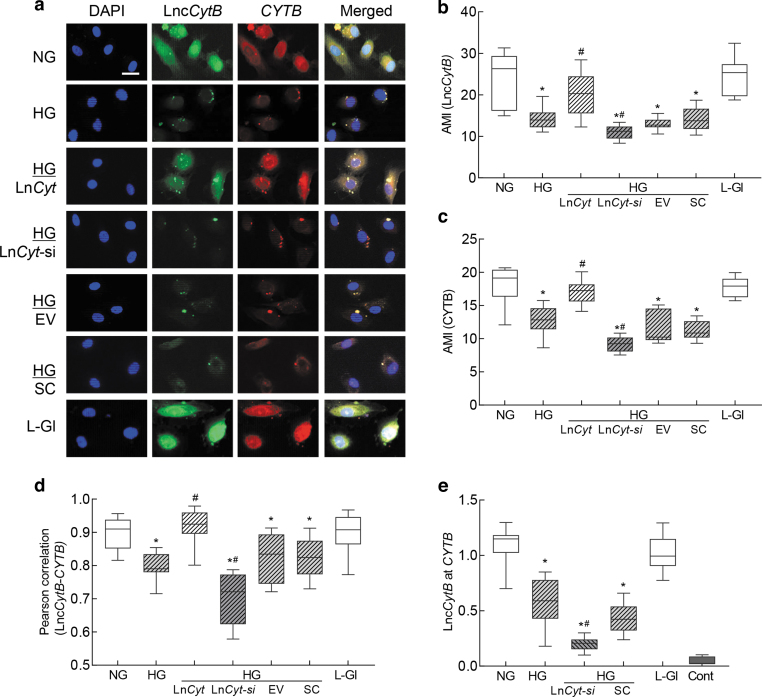
FIG. 2.
Interactions between LncCytB and CYTB. RNA-FISH was performed using fluorescein 12-dUTP–labeled LncCytB probe (green) and aminoallyl-dUTP-Texas Red incorporated CYTB probe (red). (a) Representative image of RNA-FISH and (b, c) represent AMI of LncCytB and CYTB, respectively. (d) Pearson's correlation showing the coefficient of interaction between LncCytB and CYTB. (e) Binding of LncCytB at CYTB by ChIRP technique using input values as an internal control. Values in the graphs are represented as mean ± SD from four different cell preparations, with each measurement made in duplicate. NG and HG = 5 and 20 mM d-glucose; LncCyt, LncCytB overexpressing plasmids; LncCyt-si, LncCytB-siRNA; HG/LnCyt, HG/LnCyt-si, HG/EV, and HG/SC, cells transfected with LncCytB overexpressing plasmids, LncCytB-siRNA, empty vector, or scrambled control RNA, respectively, and incubated in high glucose; L-Gl = 20 mM l-glucose; Cont, LncCytB without biotin-labeled. *p < 0.05 compared with NG and #p < 0.05 compared with HG. AMI, arithmetic mean intensity; ChIRP, chromatin isolation by RNA purification; RNA-FISH, RNA fluorescence in situ hybridization.

