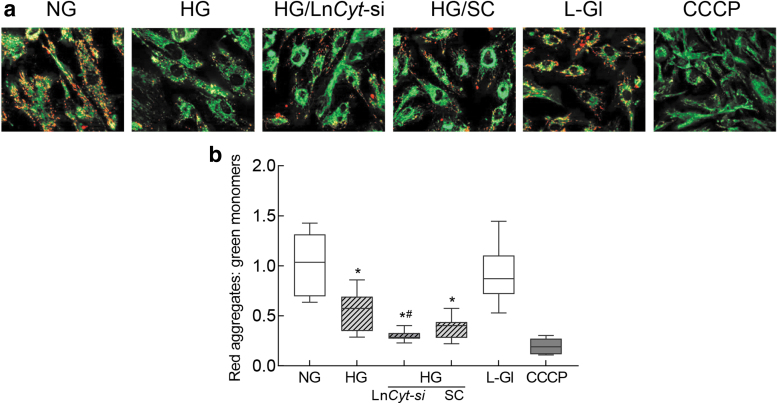
FIG. 4.
LncCytB downregulation and mitochondrial membrane potential. (a) Representative image using cationic dye JC-1 showing green (monomers) and red (aggregates). (b) Ratio of red aggregates to green monomers. Values are represented as mean ± SD from four slides per group, performed in three different cell preparations. NG = 5 mM d-glucose, HG = 20 mM d-glucose; HG/LnCyt-si and HG/SC, cells transfected with LncCytB-siRNA or scrambled control RNA and incubated in high glucose for 96 h; L-Gl = 20 mM l-glucose. *p < 0.05 compared with NG and #p < 0.05 compared with HG. CCCP, cells incubated with carbonyl cyanide 3-chlorophenylhydrazone.

