Figure 5.
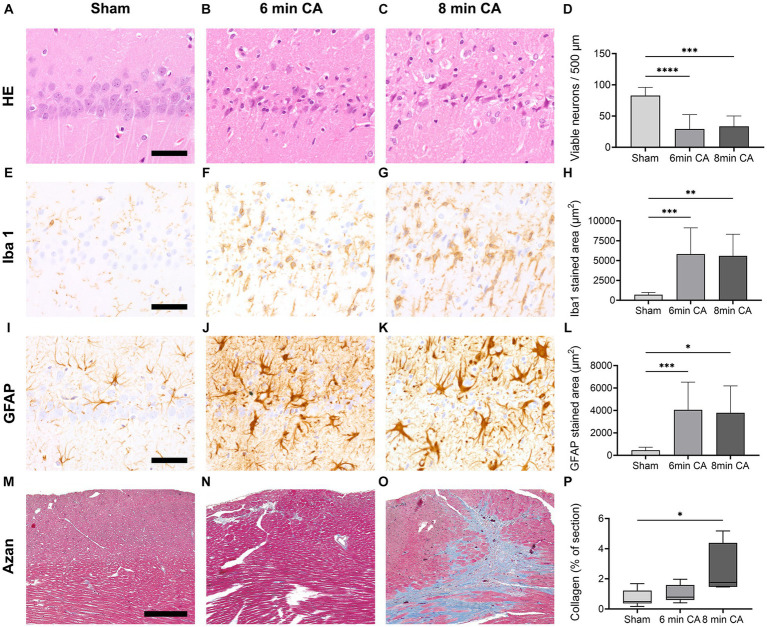
Representative images of histological and immunohistochemical stainings and according graphs of the quantitative evaluation, **** p < 0.0001, *** p < 0.001, ** p < 0.01, * p < 0.05. (A–D) HE-staining, bar = 50 μm: physiologic appearance of the hippocampal CA1 region with multiple viable neurons in a sham animal (A) compared to few viable neurons in a 6 min (B) and 8 min (C) CA animal, respectively; sham animals show significantly more viable neurons compared to CA animals [(D), mean ± SD] (E–H) Iba1 immunohistochemistry, bar = 50 μm: resting microglia with small round nuclei and fine processes in a sham animal (E) compared to highly reactive microglia with rod shaped nuclei, increased cytoplasm, and few plump processes in a 6 min (F) and 8 min (G) CA animal, respectively; the stained area is significantly increased in CA animals compared to sham animals [(H) mean ± SD] (I–L) GFAP immunohistochemistry, bar = 50 μm: physiologic appearance of astrocytes in the CA1 region with little cytoplasm and fine processes in a sham animal (I) compared to highly reactive astrocytes with increased cytoplasm and plump processes in a 6 min (J) and 8 min (K) CA animal, respectively; the stained area is significantly increased in CA animals compared to sham animals [(L) mean ± SD] (M–P) Azan-staining to detect collagen fibers, bar = 300 μm: viable myocardium (red) with very little, predominantely perivascular, autochtonous collagen (blue) in a sham animal (M) compared to a 6 min CA animal with a small focus of collagen in the left upper quadrant (N), while the 8 min CA animal shows multiple large coalescing foci of collagen fibers (O); collagen in the myocardium of 8 min CA animals was significantly increased compared to sham animals [(P) Median ± IQR].

