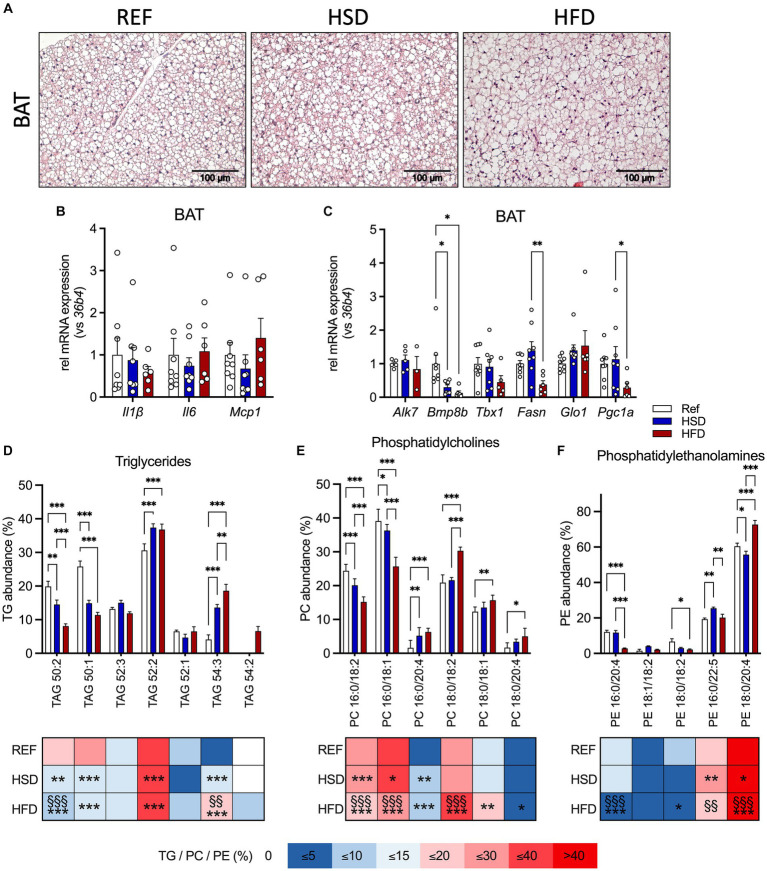
Figure 3.
Adipocyte hypertrophy, inflammation, and lipid composition in BAT in response to 12 weeks of HSD and HFD feeding. (A) Representative hematoxylin and eosin (H&E) sections of brown adipose tissue (BAT) from HSD- and HFD-fed mice and controls. (B) The expression of inflammatory genes Il1b, Il6 and Mcp1, as well as (C) expression of thermogenic genes (Alk7, Bmp8b, Tbx1, Fasn, Glo1 and Pgc1a) in BAT of HFD- and HSD-fed and control mice. (D–F) Relative abundances of triglycerides (TG; D), phosphatidylcholines (PC; E) as well as phosphatidylethanolamines (PE; F) in BAT at the end of the study. Color coding for all graphs: black - control diet; blue - HSD, red - HFD. Data are presented as mean ± SEM, with N = 6–8 mice per group. Statistical significance was tested by two-way ANOVA with Tukey’s comparisons test and is indicated as follows: *, vs. REF; § HSD vs. HFD; *, § p < 0.05; **, §§ p < 0.01; ***, §§§ p < 0.001.

