Figure 4.
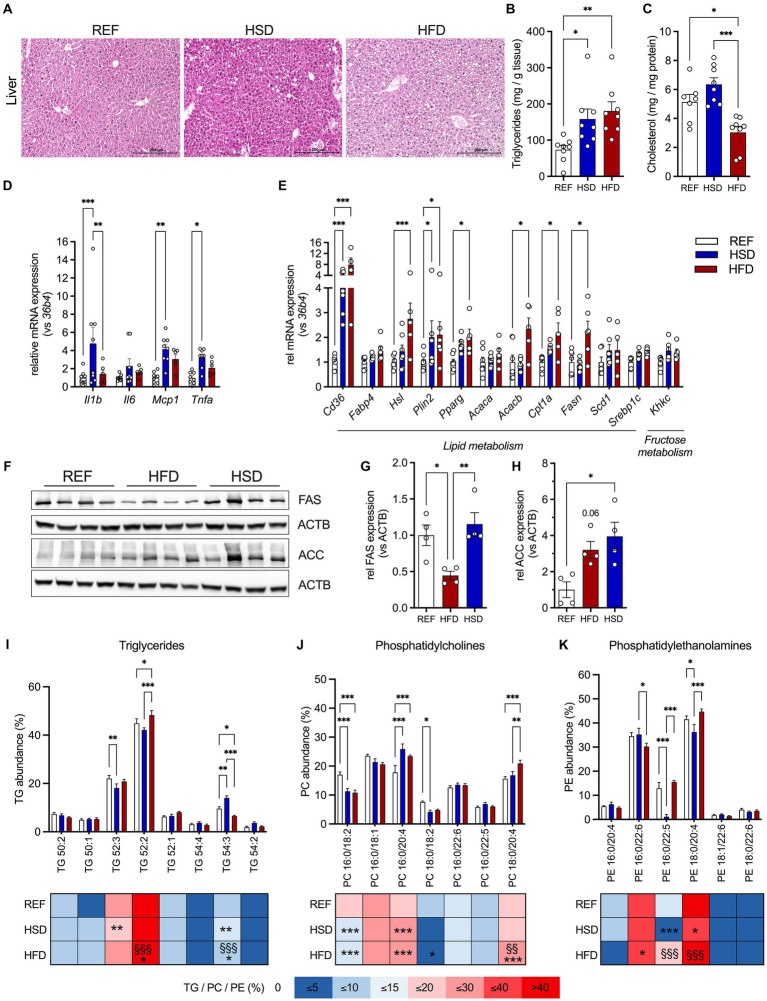
Ectopic lipid deposition, inflammation, and lipid composition in the liver in response to 12 weeks of HSD and HFD feeding. (A) Representative hematoxylin and eosin (H&E) stained liver sections of HFD- and HSD-fed and control mice. (B,C) Liver triglyceride (TG; B) and cholesterol content (C). (D) The expression of inflammatory genes Il1b, Il6, Mcp1 and Tnfa, as well as (E) expression of genes related to lipid metabolism (Cd36, Fabp4, Hsl, Plin2 and Pparg) and lipogenesis (Acaca, Acacb, Cpt1a, Fasn, Scd1, Srebp1c) and fructose metabolism (Khkc) in livers of HFD- and HSD-fed and control mice. (F) Western blot analysis of FAS and ACC expression in liver (n = 4/group). (G,H) Densitometric analyses of FAS (G) and ACC (H) expression, both normalized for ACTB expression. (I-K) Relative abundances of triglycerides (TG; I), phosphatidylcholines (PC; J) as well as phosphatidylethanolamines (PE; K) in the livers. Color coding for all graphs: black - control diet; blue - HSD, red - HFD. Data are presented as mean ± SEM, with N = 6–8 mice per group. Statistical significance was tested by ANOVA with Tukey’s (B,C,G,H) multiple comparisons test, or two-way ANOVA with Tukey’s (D,I–K) multiple comparisons test or uncorrected Fischer’s LSD (E) and is indicated as follows: *, vs. REF; § HSD vs. HFD; *, § p < 0.05; **, §§ p < 0.01; ***, §§§ p < 0.001.

