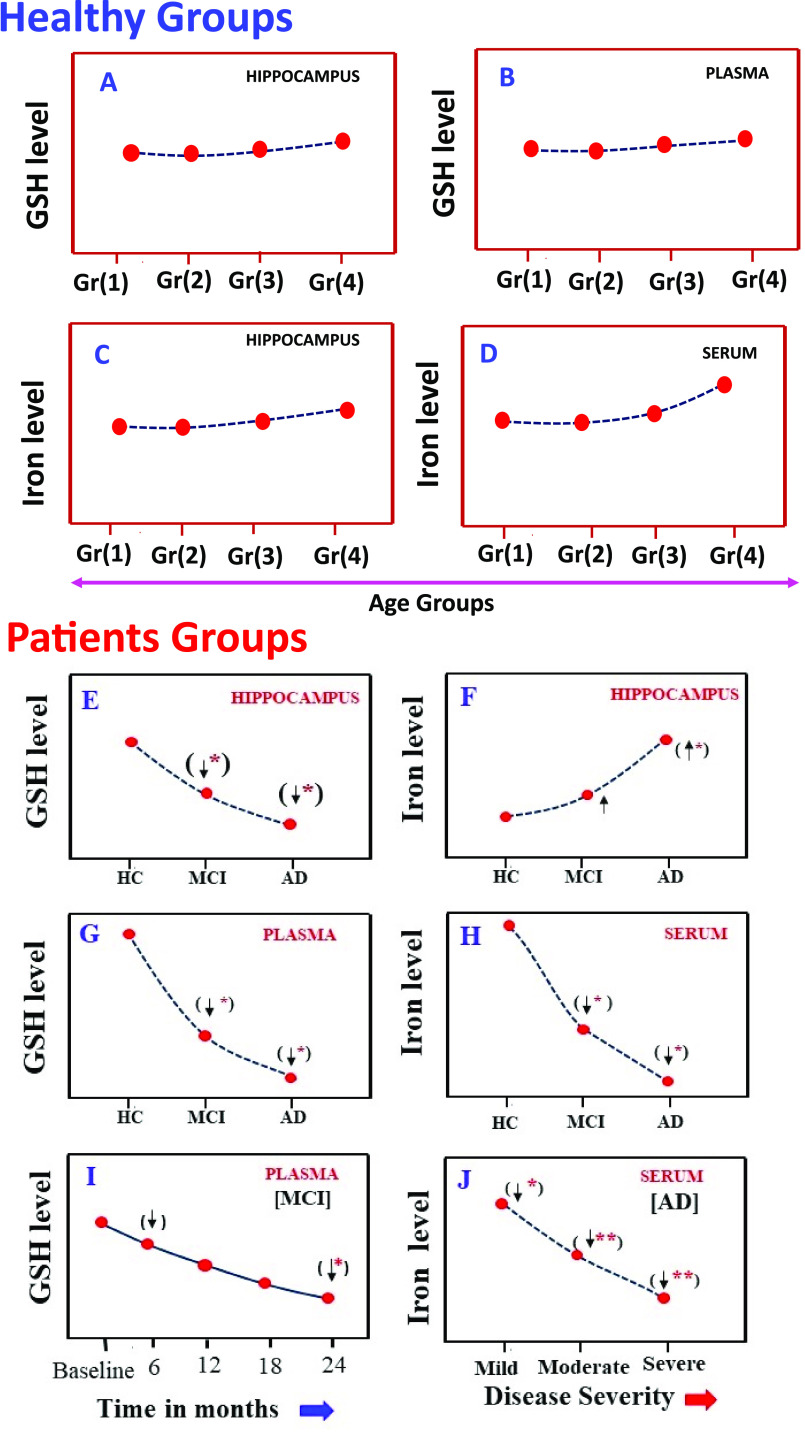
Figure 2.
Distribution pattern of GSH and iron level of hippocampus and blood (plasma/serum) in healthy subjects and patients. Part A refers to left hippocampal GSH levels from four age groups of HC subjects, and part B refers to plasma GSH levels in the same study groups.6 Parts C and D refer to left hippocampal susceptibility and blood (serum) iron levels from the same study groups of healthy subjects (Gr(1), 20–30Y; Gr(2), 31–40Y; Gr(3), 41–50Y; Gr(4), 51–73Y). Parts E and F refer to GSH levels and iron levels in the hippocampus regions for the same study participants who were assessed, where again moving across HC to MCI to AD, a significant decrease in the GSH level and a significant increase in the iron level was observed.7 Parts G and H refer to modulation of plasma GSH and serum iron levels from study participants. Part I refer to longitudinal variations of GSH level in blood (plasma) of MCI patient within two years’ time frame.8 Part J refers to depletion of iron level in the blood (serum) of AD patients with severity (mild/moderate/severe). To date, there is no report where GSH (plasma) and iron (serum) levels are measured for the same clinical population.

