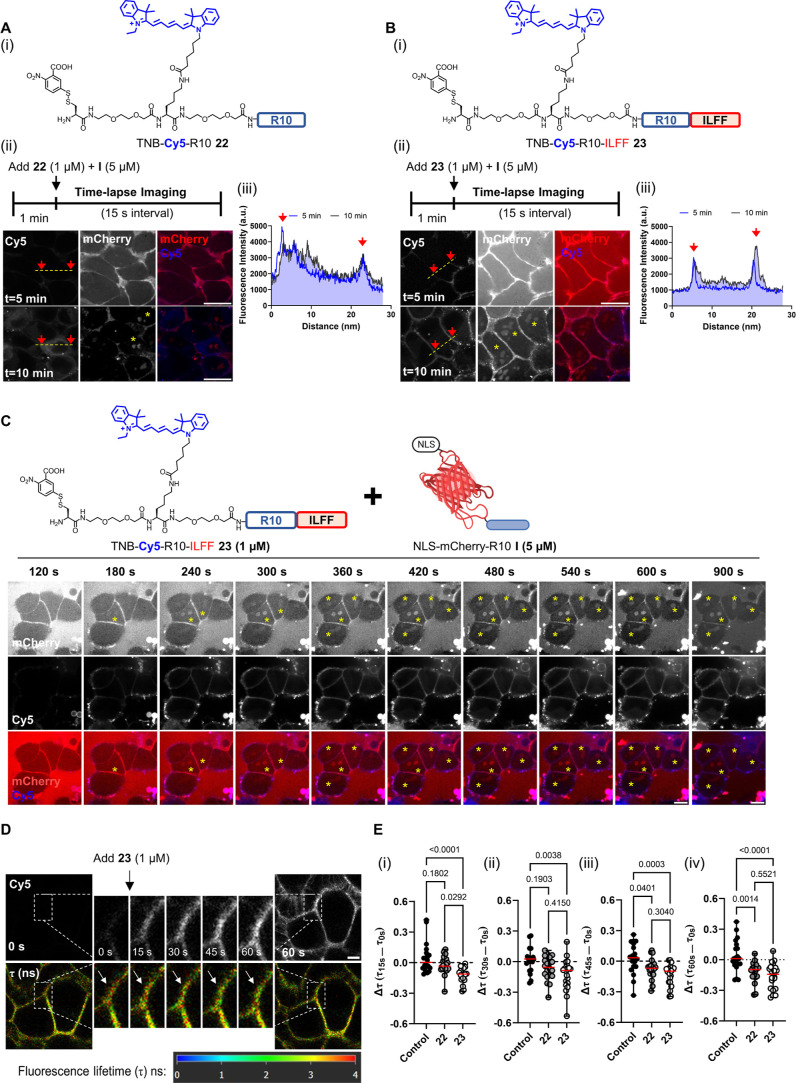
Figure 4.
Cell membrane interaction and decreased membrane tension induced by hydrophobic CPP-additive. [A(i)] Chemical structure of TNB-Cy5-R10 22. [A(ii)] Cell surface accumulation on cells treated with 1 μM of the peptide after 5 and 10 min. [A(iii)] Line-scan profile showing the distribution of Cy5 fluorescence intensity. [B(i)] Chemical structure of TNB-Cy5-R10-ILFF 23. [B(ii)] Cell surface accumulation on cells treated with 23 (1 μM) after 5 and 10 min. [B(iii)] Line-scan profile showing Cy5 fluorescence remaining within the cell periphery after prolonged incubation. (C) Time lapse images of HeLa cells treated with I (5 μM) and 23 (1 μM) in serum-free FluoroBrite DMEM for 15 min. I and 23 were added to the cells after 60 s of initial incubation. Images were taken at 60 s intervals. Yellow asterisks indicate the emergence of nucleolar signals. Scale bar: 10 μm. (D) Images showing the change in fluorescence lifetime (τ) in ns of Flipper-TR probe in HeLa cells treated with 23 (1 μM). Time-lapse images were captured every 15 s. Enlarged regions show the change of τ (white arrows) within areas with a high accumulation of 23. Scale bar, 5 μm. (E) Graphs showing individual data points indicating the change in τ (Δτ) after (i) 15, (ii) 30, (iii) 45, and (iv) 60 s of 30 selected regions-of-interest (ROIs) across three biological replicates. Δτ is calculated as the difference between the τ of a ROI after n seconds of peptide addition (τns) minus the initial τ before peptide addition (τ0s).

