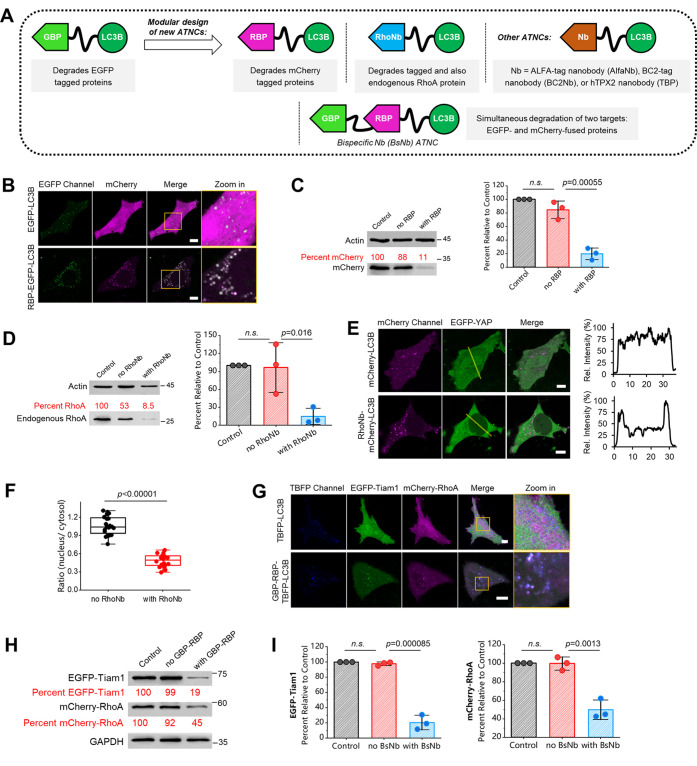
Figure 2.
ANTC is a modular degradation system: (A) ATNC is a modular tool that can degrade different targets simply by exchanging the nanobody module. (B) Confocal microscopy images of live HeLa cells coexpression of mCherry and EGFP-LC3B or RBP-EGFP-LC3B. (C) Representative WB result (48 h) and statistical comparison of the degradation of the control sample (mCherry only), no RBP group (mCherry + EGFP-LC3B), and with RBP group (mCherry + RBP-EGFP-LC3B) (n = 3 experiments). (D) Representative WB result (48 h) and statistical comparison of the degradation result of the control sample (blank), no RhoNb group (mCherry-LC3B), and with RhoNb group (RhoNb-mCherry-LC3B) (n = 3 experiments). (E) Confocal microscopy images of live HeLa cells coexpressing EGFP-YAP and mCherry-LC3B or RhoNb-mCherry-LC3B revealed export of EGFP-YAP from the nucleus to the cytosol for cells expressing RhoNb-mCherry-LC3B; line profile analysis was drawn from higher left to lower right. (F) Box plot analysis of the fluorescence ratio of EGFP-YAP in the nucleus versus cytosol (n = 20 cells for both). (G) Representative confocal microscopy images of live HeLa cells coexpressing EGFP-Tiam1, mCherry-RhoA, and TBFP-LC3B (up, control) or GBP-RBP-TBFP-LC3B (down, experiment) for 24 h. (H) Representative WB result (48 h) of the degradation of the control group (EGFP-Tiam1 + mCherry-RhoA), no GBP-RBP group (EGFP-Tiam1 + mCherry-RhoA + TBFP-LC3B), and with GBP-RBP group (EGFP-Tiam1 + mCherry-RhoA + GBP-RBP-TBFP-LC3B). (I) Statistic analysis of the WB results (n = 3 experiments); BsNb: bispecific nanobody GBP-RBP. One-sided Student’s t-test was used for related subfigures; n.s.: nonsignificant; see Methods section for description of box plots; bar graphs denote mean ± SD in this figure; mChe: mCherry; TBFP: TagBFP2.

