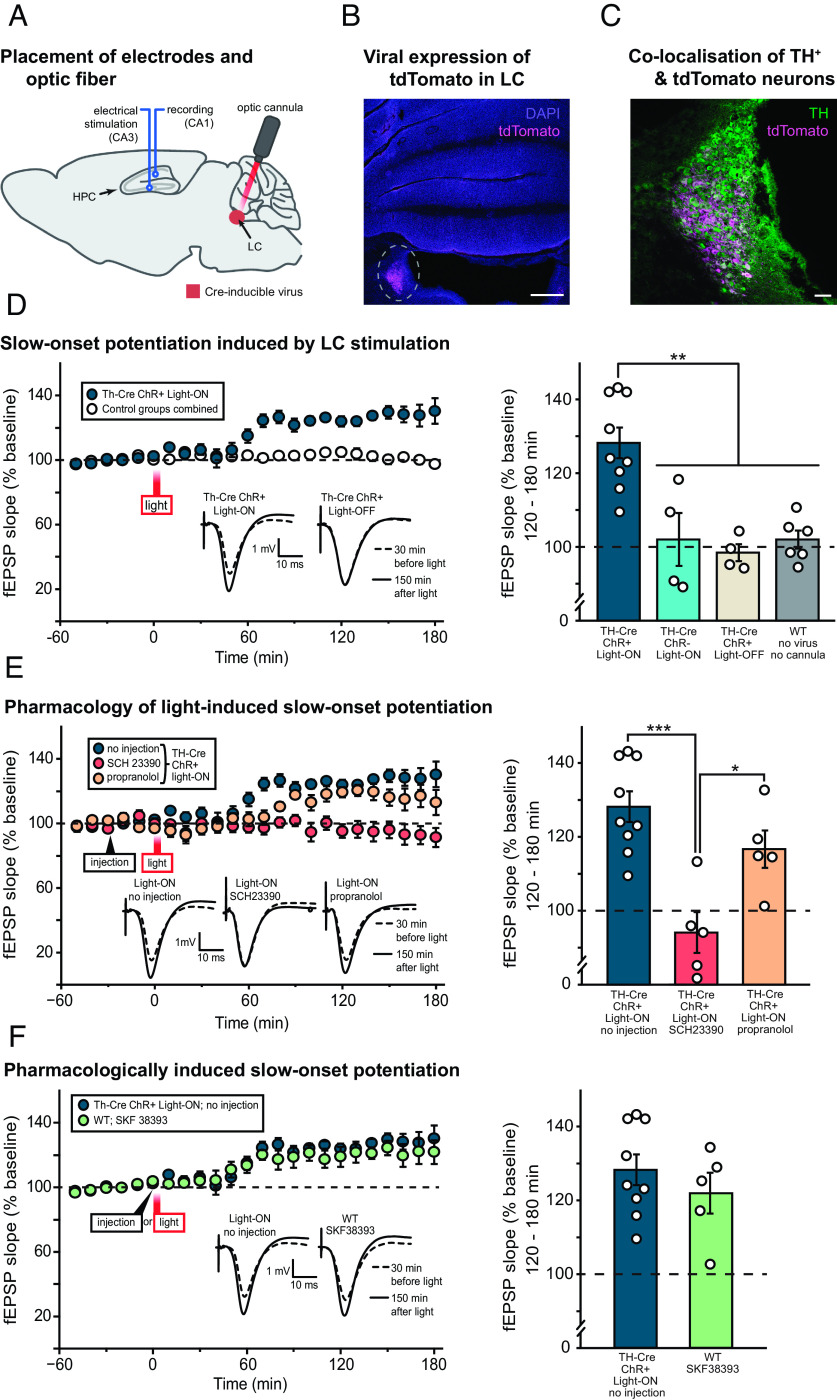
Fig. 3.
Optical stimulation of LC-TH+ neurons causes slow-onset potentiation (SOP) of CA1 fEPSPs in vivo. (A) Illustration of the placement of hippocampal stimulating and recording electrodes in CA3 and CA1 and an optic cannula in the LC of Th-Cre rat. (B) Representative example of tdTomato staining indicating viral expression in the LC beneath the location of the optic cannula, against a background of DAPI staining. The histology also showed that all optic fibers were correctly placed. (Scale bar: 500 μm.) (C) Higher magnification image of the same region, with TH and tdTomato staining overlaid. Similar colocalization of these two signals was observed in all the brains examined (a sample of 17 brains out of a total of 27, distributed across all groups). (Scale bar: 100 μm.) (D) The left-hand panel shows the time-course of SOP in the Th-Cre ChR+ Light-ON group (n = 9) plotted relative to the mean data from 14 rats comprising three control groups [Th-Cre ChR– Light-ON (n = 4), Th-Cre ChR+ Light-OFF (n = 4), and WT with no virus injection or cannula implantation (n = 6)]. Mean fEPSP slope data were analyzed over 10-min time periods and normalized to the 1-h period before optical stimulation of the LC (light). Representative examples of fEPSPs recorded circa 30 min before and 150 min after light stimulation are shown. The right-hand panel shows mean fEPSP slope potentiation 120 to 180 min after light stimulation in the Th-Cre ChR+ Light-ON group and the three control groups, now plotted separately. **P < 0.01 in all cases, post hoc Tukey’s pairwise comparisons. (E) The left-hand panel shows the impact of systemic injection of SCH 23390 (1 mg/kg of body weight, n = 5) and propranolol (6.25 mg/kg of body weight, n = 5) on SOP induced by optical stimulation of LC-TH+ neurons in Th-Cre ChR+ rats analyzed and plotted as in panel D. The “no injection” control group (the same Th-Cre ChR+ Light-ON group from panel D) is reproduced for comparison. Representative examples of fEPSPs recorded circa 30 min before and 150 min after light stimulation are shown. The right-hand panel shows mean fEPSP slope potentiation 120 to 180 min after light stimulation in the no injection, SCH 23390, and propranolol groups. *P < 0.05, ***P < 0.001; post hoc Tukey’s pairwise comparisons. (F) The left-hand panel shows the time course of SOP induced by systemic injection of SKF 38393 (3 mg/kg of body weight, n = 5), relative to SOP observed in the no injection group (the same Th-Cre ChR+ Light-ON group from panels D and E reproduced for comparison). Representative examples of fEPSPs recorded circa 30 min before and 150 min after light stimulation are shown. The right-hand panel shows mean fEPSP slope potentiation 120 to 180 min after light stimulation in the no injection and SKF 38393 groups. Means ± SEM and individual animal data plots. Dashed line in panels D–F indicates baseline fEPSP slope.

