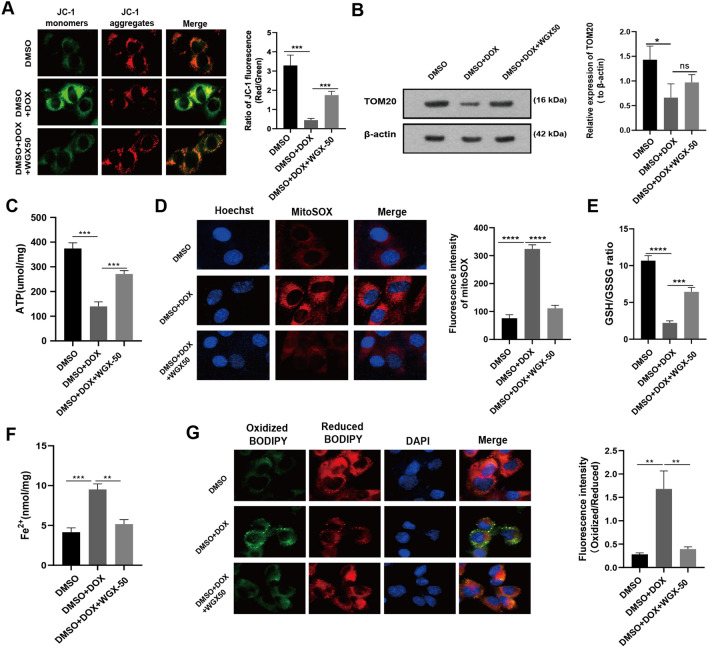
Fig. 6.
WGX50 mitigates DOX-induced mitochondrial damage and lipid peroxidation in HL-1 cells. A Mitochondrial membrane potential was measured using JC-1 fluorescent probe in the cultured HL-1 cells with 50 μM of WGX50 for 24 h, and the histogram represents the ratio of JC-1 red to green fluorescence (Red/ Green). B Western blot bands show expression level of TOM20 protein in HL-1 cells that were treated with DOX (2 μM) and WGX50 (50 μM) for 24 h. Histogram shows relative quantification of TOM20 with β-actin normalization. C The level of ATP in HL-1 cells. D Images of MitoSOX stained HL-1 cells, and the histogram shows MitoSOX fluorescence. E The GSH/GSSG ratio in HL-1 cells. F The levels of Fe2+ in the HL-1 cells. G Images of C11-BODIPY 581/591 stained HL-1 cells. Histogram presents fluorescence intensity of oxidized BODIPY (Oxidized/ Reduced). Values are expressed as mean ± SD from three independent experiments (n = 3). **, *** and **** respectively means p < 0.01, p < 0.001 and p < 0.0001

