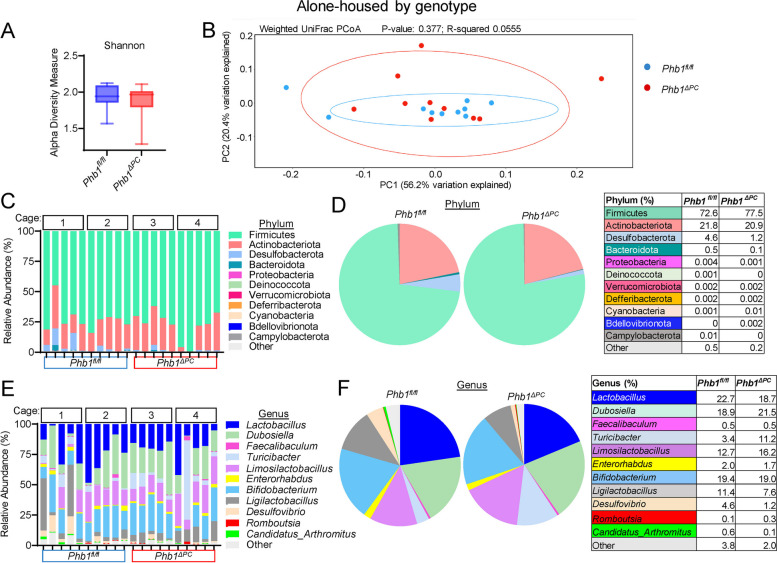
Fig. 2.
Phb1ΔPC mice exhibit similar gut microbiota composition as Phb1fl/fl littermates when alone-housed by genotype. 16S RNA sequencing of ileal luminal contents of alone-housed Phb1fl/fl and Phb1ΔPC mice. A Alpha diversity measure by Shannon index. B Weighted UniFrac PCoA plot of 16S rRNA gene sequences. C, D Relative abundance of bacteria at phylum level in individual mice (C) and combined mice by genotype (D). E, F Relative abundance of bacteria at genus level in individual mice (E) and combined mice by genotype (F). n = 10 for each genotype

