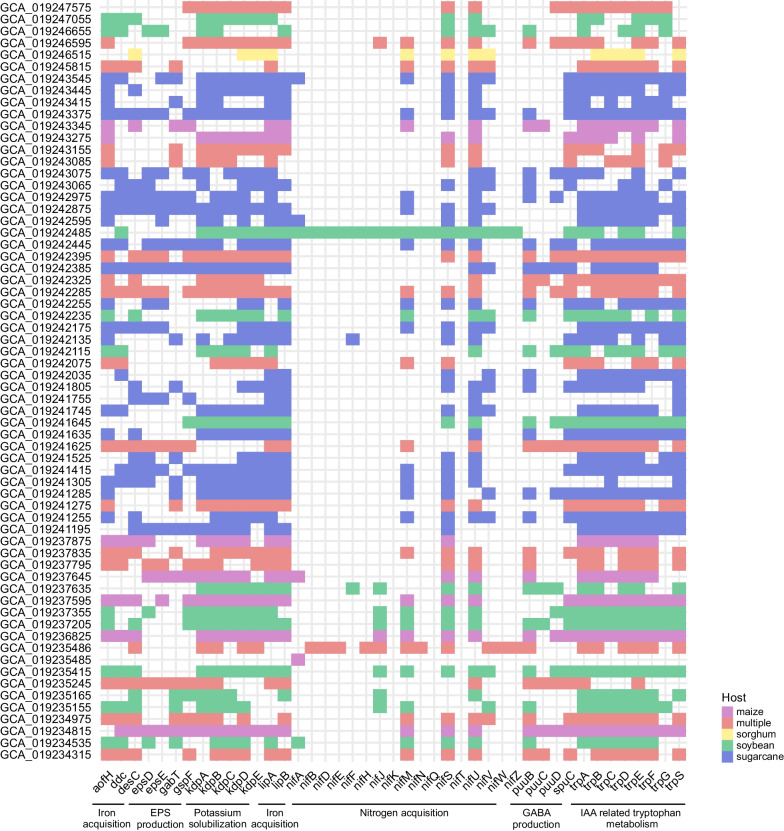
Fig. 5.
The distribution of key genes associated with plant growth-promoting traits among members of the minimal community in the microbiome from Campos rupestres. The Y-axes represent the GenBank access numbers of individual members within the reduced community, while the X-axes group the PGPT genes into categories based on their shared functions. The graph is color-coded according to the host plant, and the absence of color in squares indicates the absence of the gene. The presence of multiple, red-colored squares indicates genes found across more than two hosts. Details of all PGPT genes are in Additional file 2: Table S11 and Supplementary Data 2

