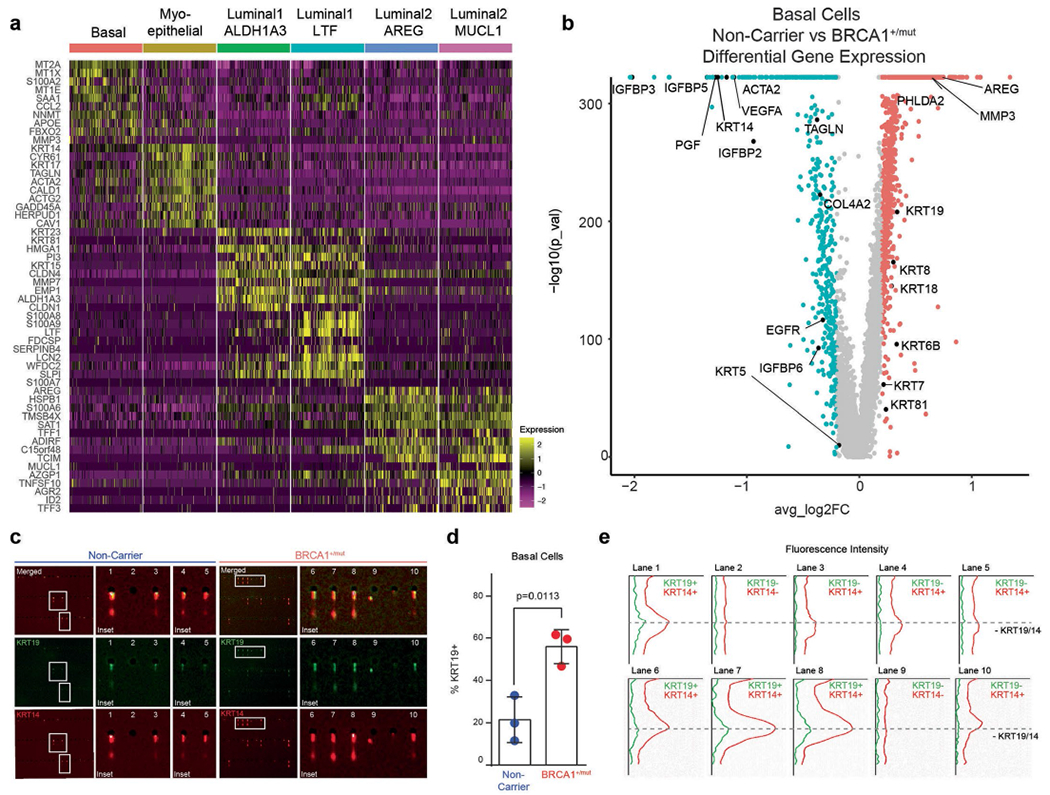
Extended Data Fig. 3 |. High-resolution scRNA-seq analysis of BRCA1+/mut epithelial cells shows increase of basal epithelial cells with altered differentiation.

a) Top 10 marker gene heatmap for epithelial cell states in BRCA1+/mut breast tissues. b) Volcano plot showing differentially expressed genes between NonCarrier and BRCA1+/mut basal epithelial cells. P values were determined using the Seurat tobit likelihood-ratio test, the wilcoxon rank sum test is used to determine differentially expressed genes, adjusted p values are determined using the Bonferroni method for multiple testing correction. c) Single-cell western blot (scWB) analyses for KRT14 and KRT19 on FACS-isolated basal epithelial cells from NonCarrier and BRCA1+/mut individuals. Representative regions of scWB chips post electrophoresis and antibody probing. d) Quantification of scWBs of all basal cells analyzed. Data is represented as mean ± SD from at least 1000 cells/individual; NonCarrier n = 3, BRCA1+/mut n = 3. P value was determined with an unpaired two-tailed t-test. e) Relative fluorescence intensity of KRT14 and KRT19 of selected lanes in scWB as indicated in c).
