
Fig. 2 |. Increased proliferation and accumulation of a luminal epithelial progenitor subset with altered differentiation in BRCA1+/mut breast tissues.
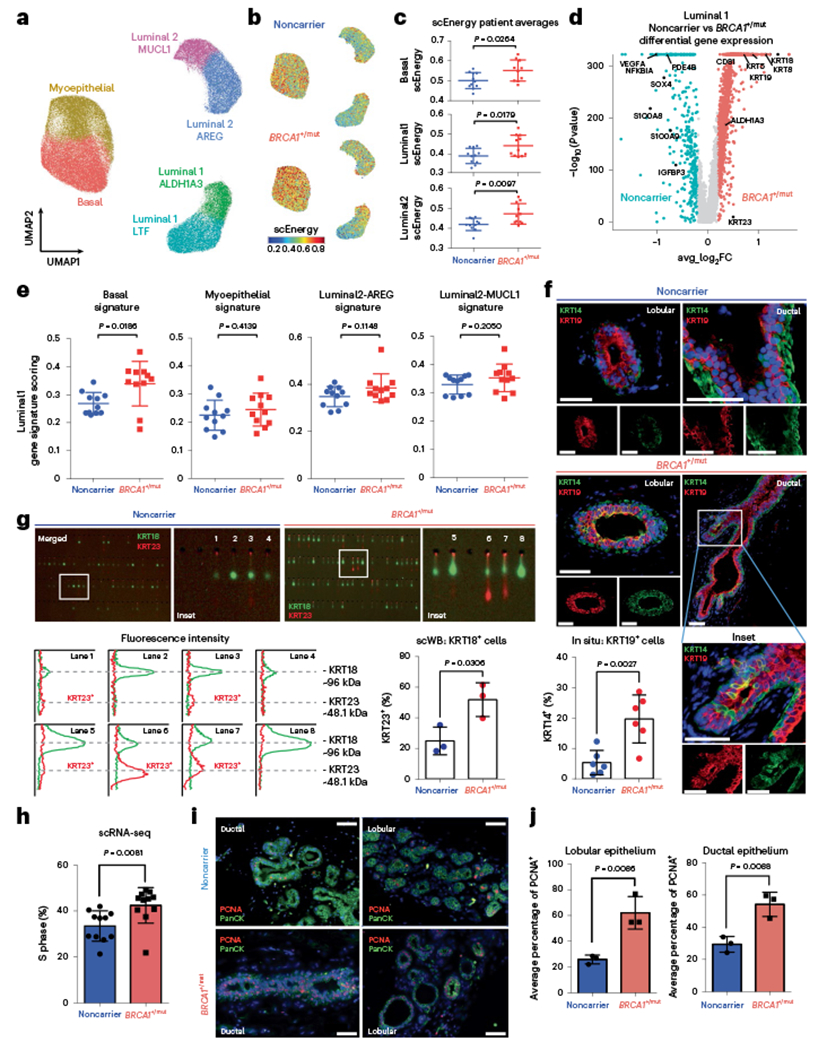
a, Unbiased clustering using UMAP projection of all patient epithelial cells. Cells are labeled by mammary epithelial cell state classification as indicated. b, UMAP feature plots displaying single-cell energy (scEnergy) in faceted plots for noncarrier (upper plot) and BRCA1+/mut cells (lower plot). c, scEnergy distributions are plotted as mean scEnergy values from an individual patient (expressed as mean ± s.e.m.) across basal (noncarrier basal = 0.5009 ± 0.01214, BRCA1+/mut basal = 0.5513 ± 0.01677), luminal 1 (noncarrier luminal 1 = 0.3910 ± 0.01150, BRCA1+/mut luminal 1 = 0.4420 ± 0.01590) and luminal 2 (noncarrier luminal 2 = 0.4150 ± 0.009314, BRCA1+/mut luminal 2 = 0.723 ± 0.01549) cell types from noncarrier and BRCA1+/mut samples. P values were determined by Welch’s two-sample t-test. d, Volcano plot displaying genes differentially expressed between noncarrier and BRCA1+/mut luminal 1 epithelial cells; genes greater than log2FC > 0.25 are colored. The Wilcoxon rank sum test (two sided) is used to determine differentially expressed genes; adjusted P values are determined using the Bonferroni method for multiple testing correction. e, Gene signature scoring of luminal 1 cells from noncarrier and BRCA1+/mut epithelial cells plotted as mean signature score values from individual patients (expressed as mean ± s.e.m.) for basal (noncarrier luminal 1 = 0.2685 ± 0.01195, BRCA1+/mut luminal 1 = 0.3396 ± 0.02406), myoepithelial (noncarrier luminal 1 = 0.2250 ± 0.01616, BRCA1+/mut luminal 1 = 0.3396 ± 0.02406), luminal 2-AREG (noncarrier luminal 1 = 0.3481 ± 0.01287, BRCA1+/mut luminal 1 = 0.3848 ± 0.01801) and luminal 2-MUCL1 (noncarrier luminal 1 = 0.3299 ± 0.01016, BRCA1+/mut luminal 1 = 0.3535 ± 0.01473) marker gene signatures. P values were determined by Welch’s two-sample t-test. f, In situ IF analysis of KRT14/KRT19-double positive cells of lobular and ductal regions in noncarrier and BRCA1+/mut tissues with representative images shown. Scale bar = 50 μm. Bar chart (bottom left) indicates the percentage of KRT14/KRT19-double positive cells in noncarrier (n = 6) and BRCA1+/mut (n = 6). Values are expressed as mean ± s.d. quantified from at least five random fields per patient sample. P value was determined using an unpaired two-tailed t-test. g, Single-cell Western blot (ScWB)-based quantification of KRT23-positive luminal epithelial cells isolated by FACS from noncarrier (n = 3) and BRCA1+/mut (n = 3). Images are representative regions of scWB chips post electrophoresis and antibody probing. Bar chart values are represented as mean ± s.d. from at least 1,000 cells per individual; n = 3 noncarrier, and n = 3 BRCA1+/mut. P value was determined using an unpaired two-tailed t-test. h, Bar chart shows the percentage (expressed as mean ± s.e.m.) of each patient’s noncarrier (0.3346 ± 0.01990, n = 11) and BRCA1+/mut (0.4245 ± 0.2323, n = 11) epithelial cells in S phase as identified by Seurat cell-cycle scoring analysis. P value was calculated by an unpaired two-tailed t-test. i, Representative images from IF analysis of pan-cytokeratin (PanCK, green) and PCNA (red) expression in ductal and lobular regions of noncarrier and BRCA1+/mut breast tissues. Scale bar = 50 μm. j, Bar graphs showing the average percentage (expressed as mean ± s.e.m.) of PCNA + cells in five regions each from noncarrier (n = 3) and BRCA1+/mut (n = 3) patients by in situ IF analysis of lobular (noncarrier = 25.89 ± 1.957, BRCA1+/mut = 62.11 ± 7.286) and ductal (noncarrier = 29.40 ± 2.812, BRCA1+/mut = 54.23 ± 4.366) areas. P values were determined by unpaired two-tailed t-test.