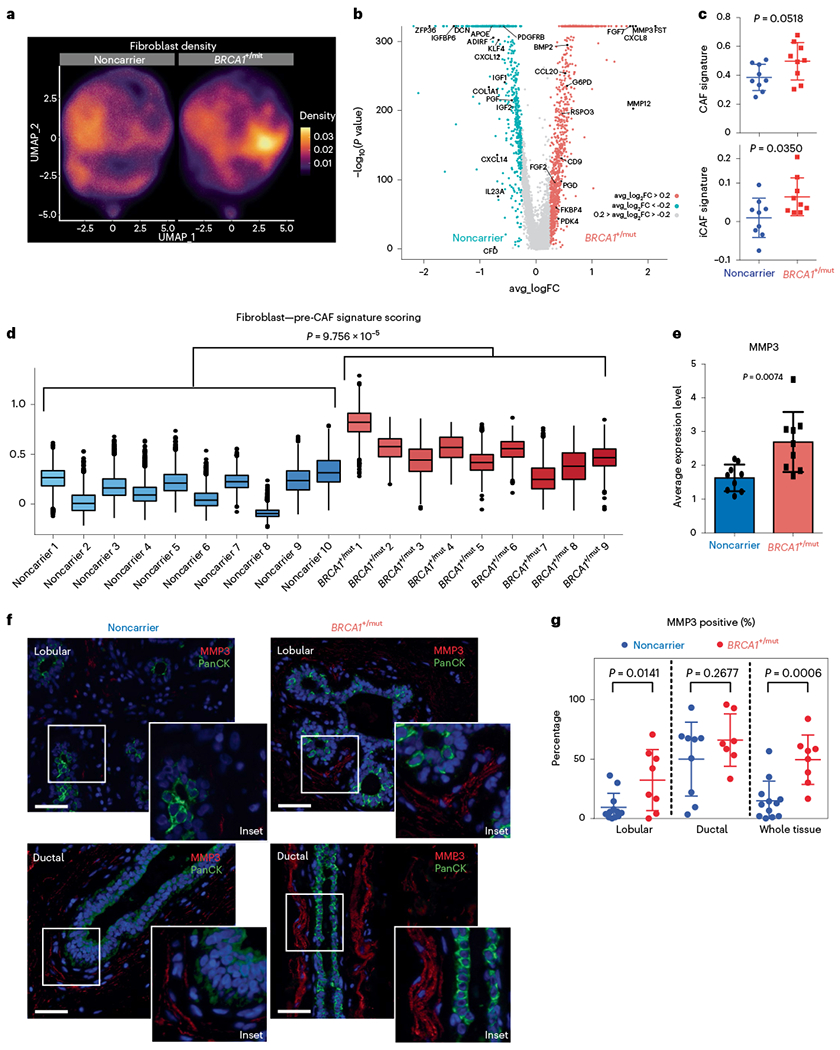
Fig. 4 |. Expansion of CAF-like, MMP3-expressing fibroblasts in premalignant BRCA1+/mut breast tissues.

a, UMAP projection of cell density in noncarrier and BRCA1+/mut fibroblasts. b, Volcano plot with all differentially expressed genes between noncarrier and BRCA1+/mut fibroblasts. The Wilcoxon rank sum test is used to determine differentially expressed genes. Adjusted P values are determined using the Bonferroni method for multiple testing correction. Top 50 BRCA1+/mut genes were used to define pre-CAF signature. Top 50 noncarrier genes were used to define noncarrier fibroblast signature. c, Gene signature scoring of all noncarrier (n = 9 patients) and BRCA1+/mut (n = 9 patients) fibroblasts CAF and iCAF signatures. Each point represents the average score from one patient’s fibroblasts. Data are presented as the mean ± s.d. P values were determined by Welch’s two-sample t-tests. Patient scRNA-seq libraries with less than ~250 fibroblasts (<10% of mean number of fibroblasts) were excluded. d, Pre-CAF gene signature scoring in fibroblasts from individual patients. Patient scRNA-seq libraries with less than ~250 fibroblasts (<10% of mean number of fibroblasts) were excluded. Boxplots indicate median and 25 and 75% quantiles, respectively; minima and maxima represent the 10th and 90th percentile, respectively. P value was determined by Welch two-sample t-test comparing mean pre-CAF signature scores between noncarrier and BRCA1+/mut patients. e, Bar chart of the average MMP3 expression in noncarrier (n = 9 patients) and BRCA1+/mut (n = 9 patients) fibroblasts. Each point represents the average score from one patient’s fibroblasts, data are presented as the mean ± s.d. P values were determined by Welch’s two-sample t-test. f, Representative images of in situ IF analysis of MMP3 (red) and PanCK (green) expression in lobular and ductal regions of breast epithelium from noncarrier and BRCA1+/mut human tissue sections. Scale bar = 50 μm. DAPI signal is shown in blue. g, Percentages of MMP3-positive stromal cells in noncarrier (blue) and BRCA1+/mut (red) samples as manually quantified from IF images. PanCK-positive epithelial cells were excluded from counts. Values are expressed as mean ± s.d. quantified from at least five random fields per patient sample. P value was determined using an unpaired two-tailed t-test.
