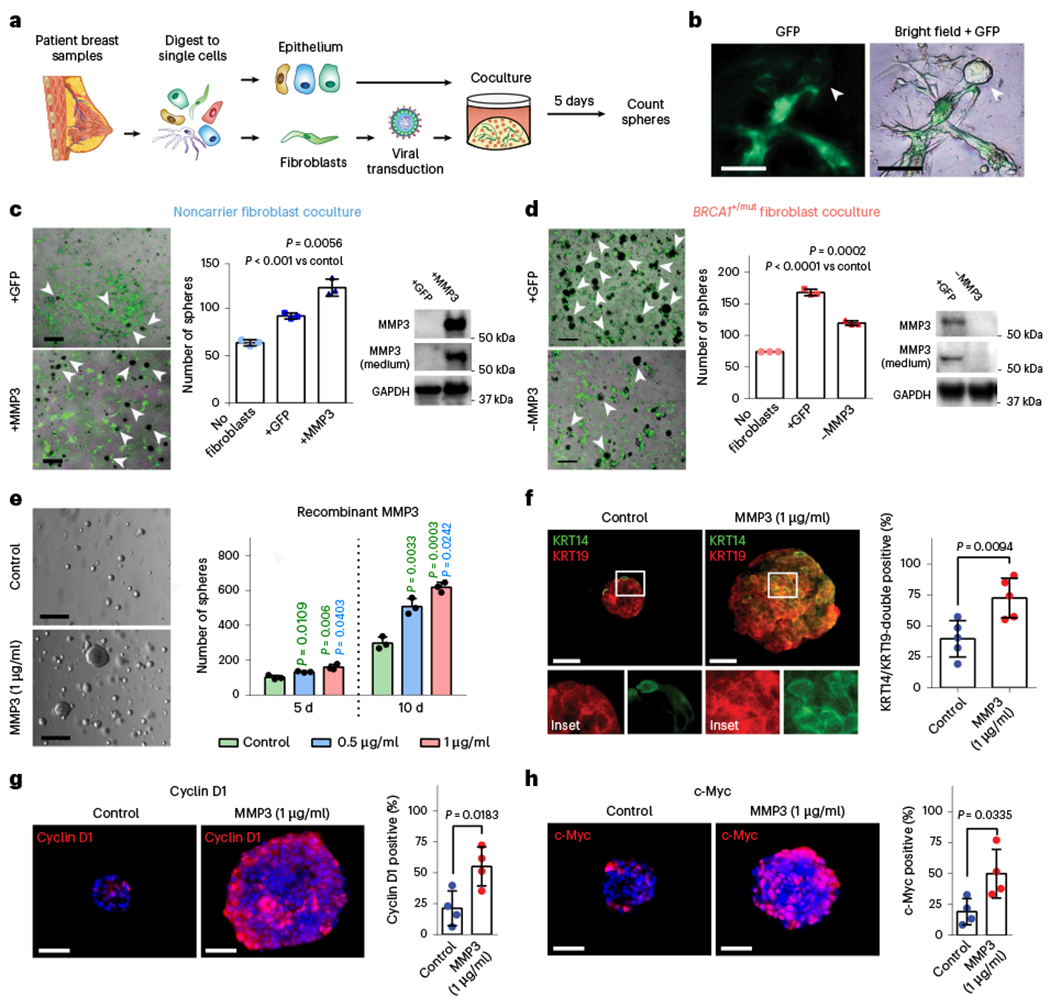
Fig. 5 |. MMP3-expressing pre-CAFs promote breast epithelial proliferation and altered differentiation in primary human cocultures in vitro.

a, Schematic depicting experimental set-up for sphere assays of primary human 3D coculture using FACS-isolated epithelial cells and lentivirally transduced fibroblasts. b, Representative images depicting green fluorescent protein (GFP) expression in transduced fibroblasts in close proximity to epithelial organoids (arrow). Scale bar = 100 μm. c, Cocultures (5 d) of 4,000 breast epithelial cells seeded alone (no fibroblasts) or with 1 × 10⁵ noncarrier fibroblasts transduced with lentivirus (+GFP) or transduced to express MMP3 and GFP (+MMP3). Western blots show increased expression of MMP3 in cells and cultured supernatant of +MMP3 fibroblasts. Representative merged bright-field and GFP images of cocultures (scale bar = 400 μm) with arrows indicating epithelial mammospheres (GFP-negative). Bar charts (right) represent the number of mammospheres per well; values expressed as mean ± s.d. from three separate experiments with three triplicate wells from each. P values were determined using unpaired two-tailed t-tests. No fibroblasts versus +GFP, P = 0.0004; no fibroblasts versus +MMP3, P = 0.0005. d, Cocultures (5 d) of 4,000 breast epithelial cells seeded alone (No fibroblasts) or with 1 × 10⁵ BRCA1+/mut fibroblasts transduced with lentivirus to express CRISPR–Cas9 and MMP3 gRNA (−MMP3) and GFP or GFP only (+GFP) vectors. Western blots show decreased expression of MMP3 in cells and medium from MMP3-deficient fibroblast cultures. Representative overlay bright-field and GFP images of cocultures (scale bar = 400 μm) with arrows indicating mammospheres (GFP-negative). Bar charts (right) represent the number of mammospheres per well; values expressed as mean ± s.d. from triplicates of three independent experiments. P values were determined using unpaired two-tailed t-tests. e, 1 × 10⁵ FACS-isolated epithelial cells from patient sample ‘noncarrier 36’ were seeded in Matrigel and treated with 0.5 μg ml−1 or 1 μg ml−1 recombinant MMP3 and spheres were counted after 5 d and 10 d. Representative bright-field images of mammospheres after 10 d of culture (scale bar = 400 μm). Bar chart depicts mean ± s.d. from triplicates of three independent experiments. P values were determined using unpaired two-tailed t-tests. f, 1 × 10⁴ primary breast epithelial cells were seeded and cultured in Matrigel for 10 d with or without human recombinant MMP3. After 10 d, mammospheres were collected and subjected to IF staining for basal (KRT14; green) and luminal (KRT19; red) markers. Representative fluorescence images of mammospheres are shown. Scale bar = 50 μm. Bar chart shows the percentage of KRT14/KRT19-double positive cells. Data are presented as mean ± s.d. from four different patient epithelial cell donors per group (n = 4), with five random fields quantified per sample. P values were determined by unpaired two-tailed t-tests. g, IF staining for Cyclin D1 (red) of organoids with and without exogenous MMP3 after 10 d of mammosphere culture. DAPI staining is shown in blue. Representative fluorescence images of mammospheres are shown. Scale bar = 50 μm. Bar chart shows the percentage of Cyclin D1-positive cells. Data are presented as mean ± s.d. from four different patient epithelial cell donors per group (n = 4), with five random fields quantified per sample. P values were determined by unpaired two-tailed t-tests. h, IF staining for c-Myc (red) of organoids with and without exogenous MMP3 after 10 d of mammosphere culture. DAPI staining is shown in blue. Representative fluorescence images of mammospheres are shown. Scale bar = 50 μm. Bar chart shows the percentage of c-Myc-positive cells. Data are presented as mean ± s.d. from four different patient epithelial cell donors per group (n = 5), with five random fields quantified per sample. P values were determined by unpaired two-tailed t-tests.
