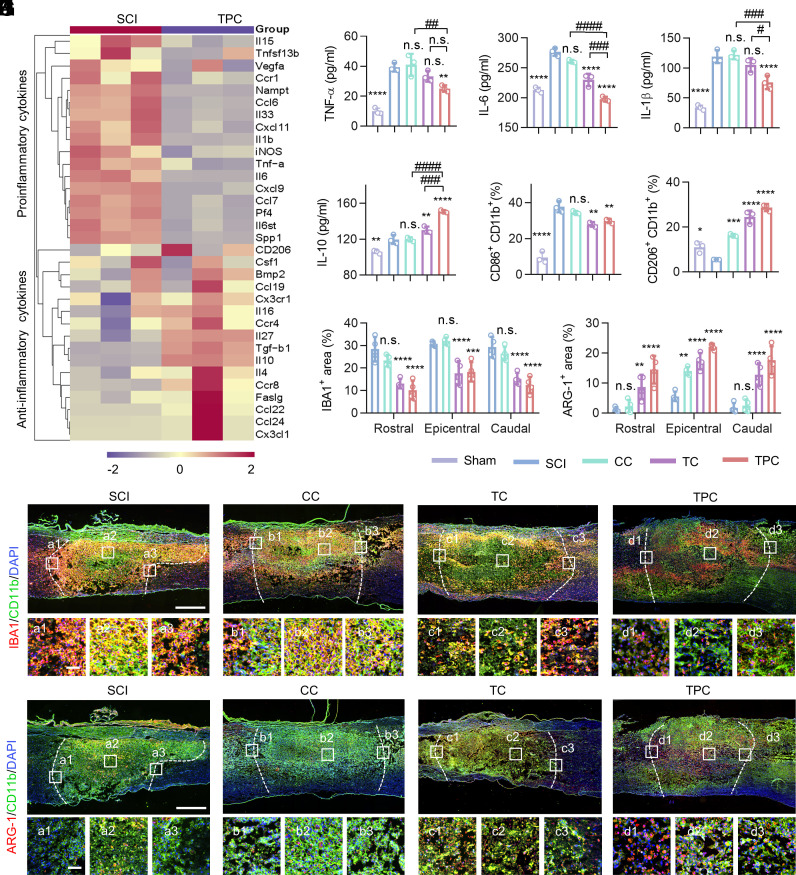
Fig. 5.
Regulation of SCI inflammatory responses. (A) Heatmap obtained from qRT-PCR assays showing mRNA levels of inflammatory and antiinflammatory cytokines in SCI and TPC groups at 3 dpi (n = 3). (B–E) Enzyme-linked immunosorbent assay (ELISA) results of TNF-α (B), IL-6 (C), IL-1β (D), and IL-10 (E) of spinal cord specimens at 3 dpi (n = 3). (F and G) Proportion of CD206+ CD11b+ (F) and CD86+ CD11b+ (G) cells in injured spinal cords quantified by flow cytometry at 7 dpi (n = 3). (H and I) Quantification of IBA1+ (H), ARG-1+ (I) area percentages (n = 4) according to the immunofluorescence images in (J) and (K). (J and K) Representative images of lesion areas in different groups at 7 dpi, which were stained with anti-IBA1 (red)/anti-CD11b (green) antibodies (J) and anti-ARG-1 (red)/anti-CD11b (green) antibodies (K), respectively. Cell nuclei were stained with DAPI (blue). Enlarged images of the box regions are shown in the bottom panel. (Scale bars: 500 μm [Top] and 100 μm [Bottom].) All data are mean ± SD (B–I) One-way ANOVA followed by Tukey’s post hoc test. *P < 0.05, **P < 0.01, ***P < 0.001, and ****P < 0.0001 compared with the SCI group. #P < 0.05, ###P < 0.001, and ####P < 0.0001 compared with the TPC group. n.s. = not significant.

