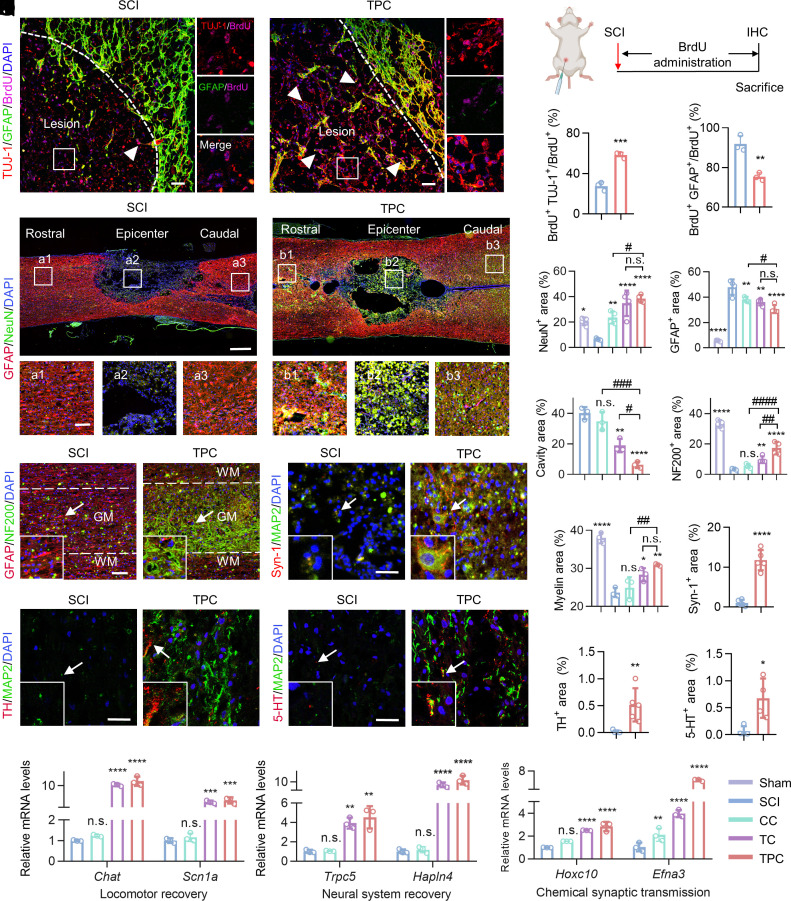
Fig. 6.
Promotion of axon regrowth and neural circuit reconstruction in vivo. (A) Representative immunostaining images of lesion sites in the SCI and TPC groups at 4 wpi, which were stained with anti-TUJ-1 (red)/anti-GFAP (green)/anti-BrdU (magenta) antibodies and DAPI (blue). Enlarged images of the box regions are shown in the right panel. The white arrows indicate TUJ-1+ BrdU+ cells. White dashed lines indicate the border of lesion areas. (Scale bar: 50 μm.) (B) Experimental design for BrdU administration after SCI. (C) The proportion of BrdU+ TUJ-1+ cells to BrdU+ cells at the epicenter of lesion areas in SCI and TPC (n = 3) groups. (D) The proportion of BrdU+ GFAP+ cells to BrdU+ at the boundary of the lesion areas. (E) Representative immunostaining images of lesion areas in the SCI and TPC groups at 8 wpi, which were stained with anti-NeuN antibodies (red), anti-GFAP antibodies (green), and DAPI (blue). White boxes indicate the rostral border (a1 and b1), the epicenter (a2 and b2), and the caudal border (a3 and b3) of injured spinal cords. (Scale bar: 500 μm [Top] and 100 μm [Bottom].) (F and G) Quantification of the percentages of NeuN+ (F) and GFAP+ (G) areas to focal areas (n = 4). (H and I) Quantification of the percentages of cavity (n = 3) (H) and NF200+ (n = 4) (I) areas to focal areas. (J) Representative immunostaining images of lesion areas in the SCI and TPC groups at 8 dpi, which were stained with anti-NF200 (red)/anti-GFAP (green) antibodies and DAPI (blue). GM, gray matter. WM, white matter. An enlarged view of the box region as indicated with the arrow is shown on the bottom left. The distance of the selected sites from the epicenter of injured spinal cords is 1.5 mm. (K) Quantification of the percentages of myelin areas to focal areas (n = 3). (L) Representative immunostaining images of lesion areas in the SCI and TPC groups at 8 dpi, which were stained with anti-Syn-1 (red)/anti-MAP2 (green) antibodies and DAPI (blue). (M) Quantification of the percentages of Syn-1+ areas to focal areas (n = 5). (N and O) Representative immunostaining images of lesion areas in the SCI and TPC groups at 8 dpi, which were stained with anti-TH (red)/anti-MAP2 (green) antibodies (N), and anti-5-HT (red)/anti-MAP2 (green) antibodies (O), respectively. Cell nuclei were stained with DAPI (blue). (P and Q) Quantification of the percentages of TH+ (n = 5) (P) and 5-HT+ (n = 4) (Q) areas to focal areas. Scale bar: 100 μm in (J), 50 μm in (L, N and O). (R–T) Relative mRNA levels (qRT-PCR assay) of Chat and Scn1 (R), Hoxc10 and Efna3 (S), and Trpc5 and Hapln4 (T) of spinal cord tissue in different groups at 8 wpi (n = 3), which were normalized against the sham group. All data represent the mean ± SD. (F, G, H, I, K, R–T) One-way ANOVA followed by Tukey’s post hoc test; (C, D, M, P and Q) Student’s two-tailed unpaired t test. *P < 0.05, **P < 0.01, ***P < 0.001, and ****P < 0.0001 compared with SCI group. #P < 0.05, ###P < 0.001, and ####P < 0.0001 compared with TPC group. n.s. = not significant.

