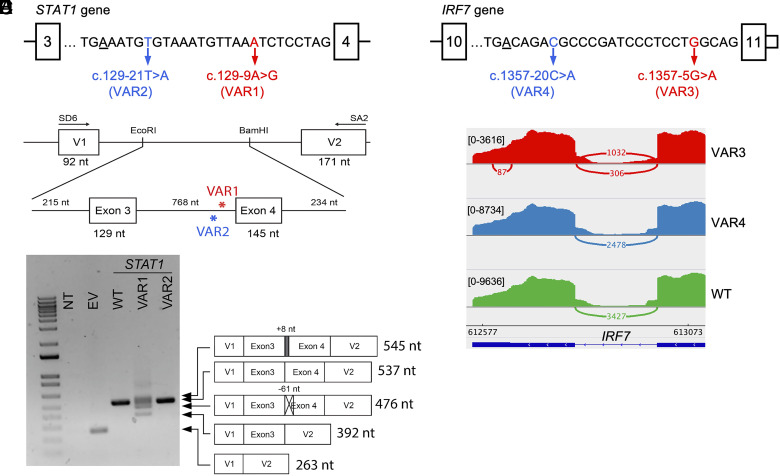
Fig. 6.
Impact on splicing by intronic AG-gain variants from the same intron of STAT1 and IRF7 that are inside and outside the high-risk region. (A) Two intronic AG-gain variants of STAT1 that are inside (VAR1) and outside (VAR2) the high-risk region, where BP is underscored. (B) Schematic diagram of the exon trapping experiment. (C) Agarose gel electrophoresis of RT-PCR products using primers within pSPL3 exon V1 and exon V2 from nontransfected (NT); transfected COS7 cells with empty vector (EV); and pSPL3 vectors carrying WT, VAR1, and VAR2 of STAT1. WT and mutant transcripts, determined by PCR amplicon sequencing, are depicted to the right side of the gel image. (D) Two intronic AG-gain variants of IRF7 that are inside (VAR3) and outside (VAR4) the high-risk region. (E) Sashimi plot of RNAseq reads mapped to exon 10, exon 11, and the splice junction of IRF7, from VAR3, VAR4, and WT samples.

