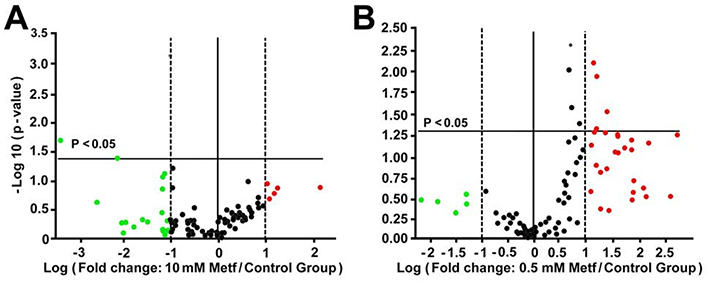
Fig. 6. Effect of metformin on expression of genes involved in mitochondrial respiration.
The volcano plot demonstrates statistical significance (p < 0.05) versus magnitude of change on the y- and x-axes, respectively. The horizontal solid line specifies the significance threshold where p < 0.05; all points above the line are considered statistically significant. The vertical central line indicates unchanged gene expression. The vertical dotted lines indicate the selective fold regulation threshold. Data points beyond the dotted lines in the right (red, upregulated) and left (green, downregulated) sections meet the 2-fold regulation threshold; n=3 for each group.

