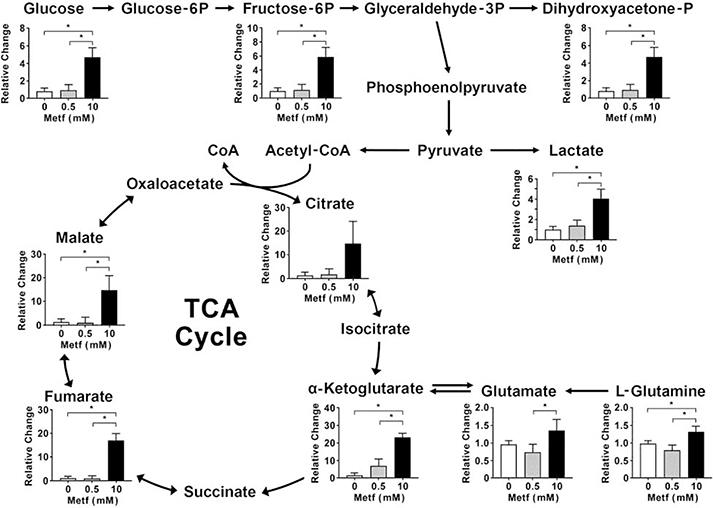
Fig. 9. Metformin at high concentrations triggers metabolic reprograming towards glycolysis and glutaminolysis.
The hiPSC-CMs were treated with 0.5 mM and 10 mM metformin (Metf) for 24 hours, then subjected to extraction of metabolites and LC-MS analysis. Data are expressed as mean ± SD, * p < 0.05 compared to 0 mM and 0.5 mM Metf (one-way ANOVA and post hoc Tukey test); n=3 for each group.

