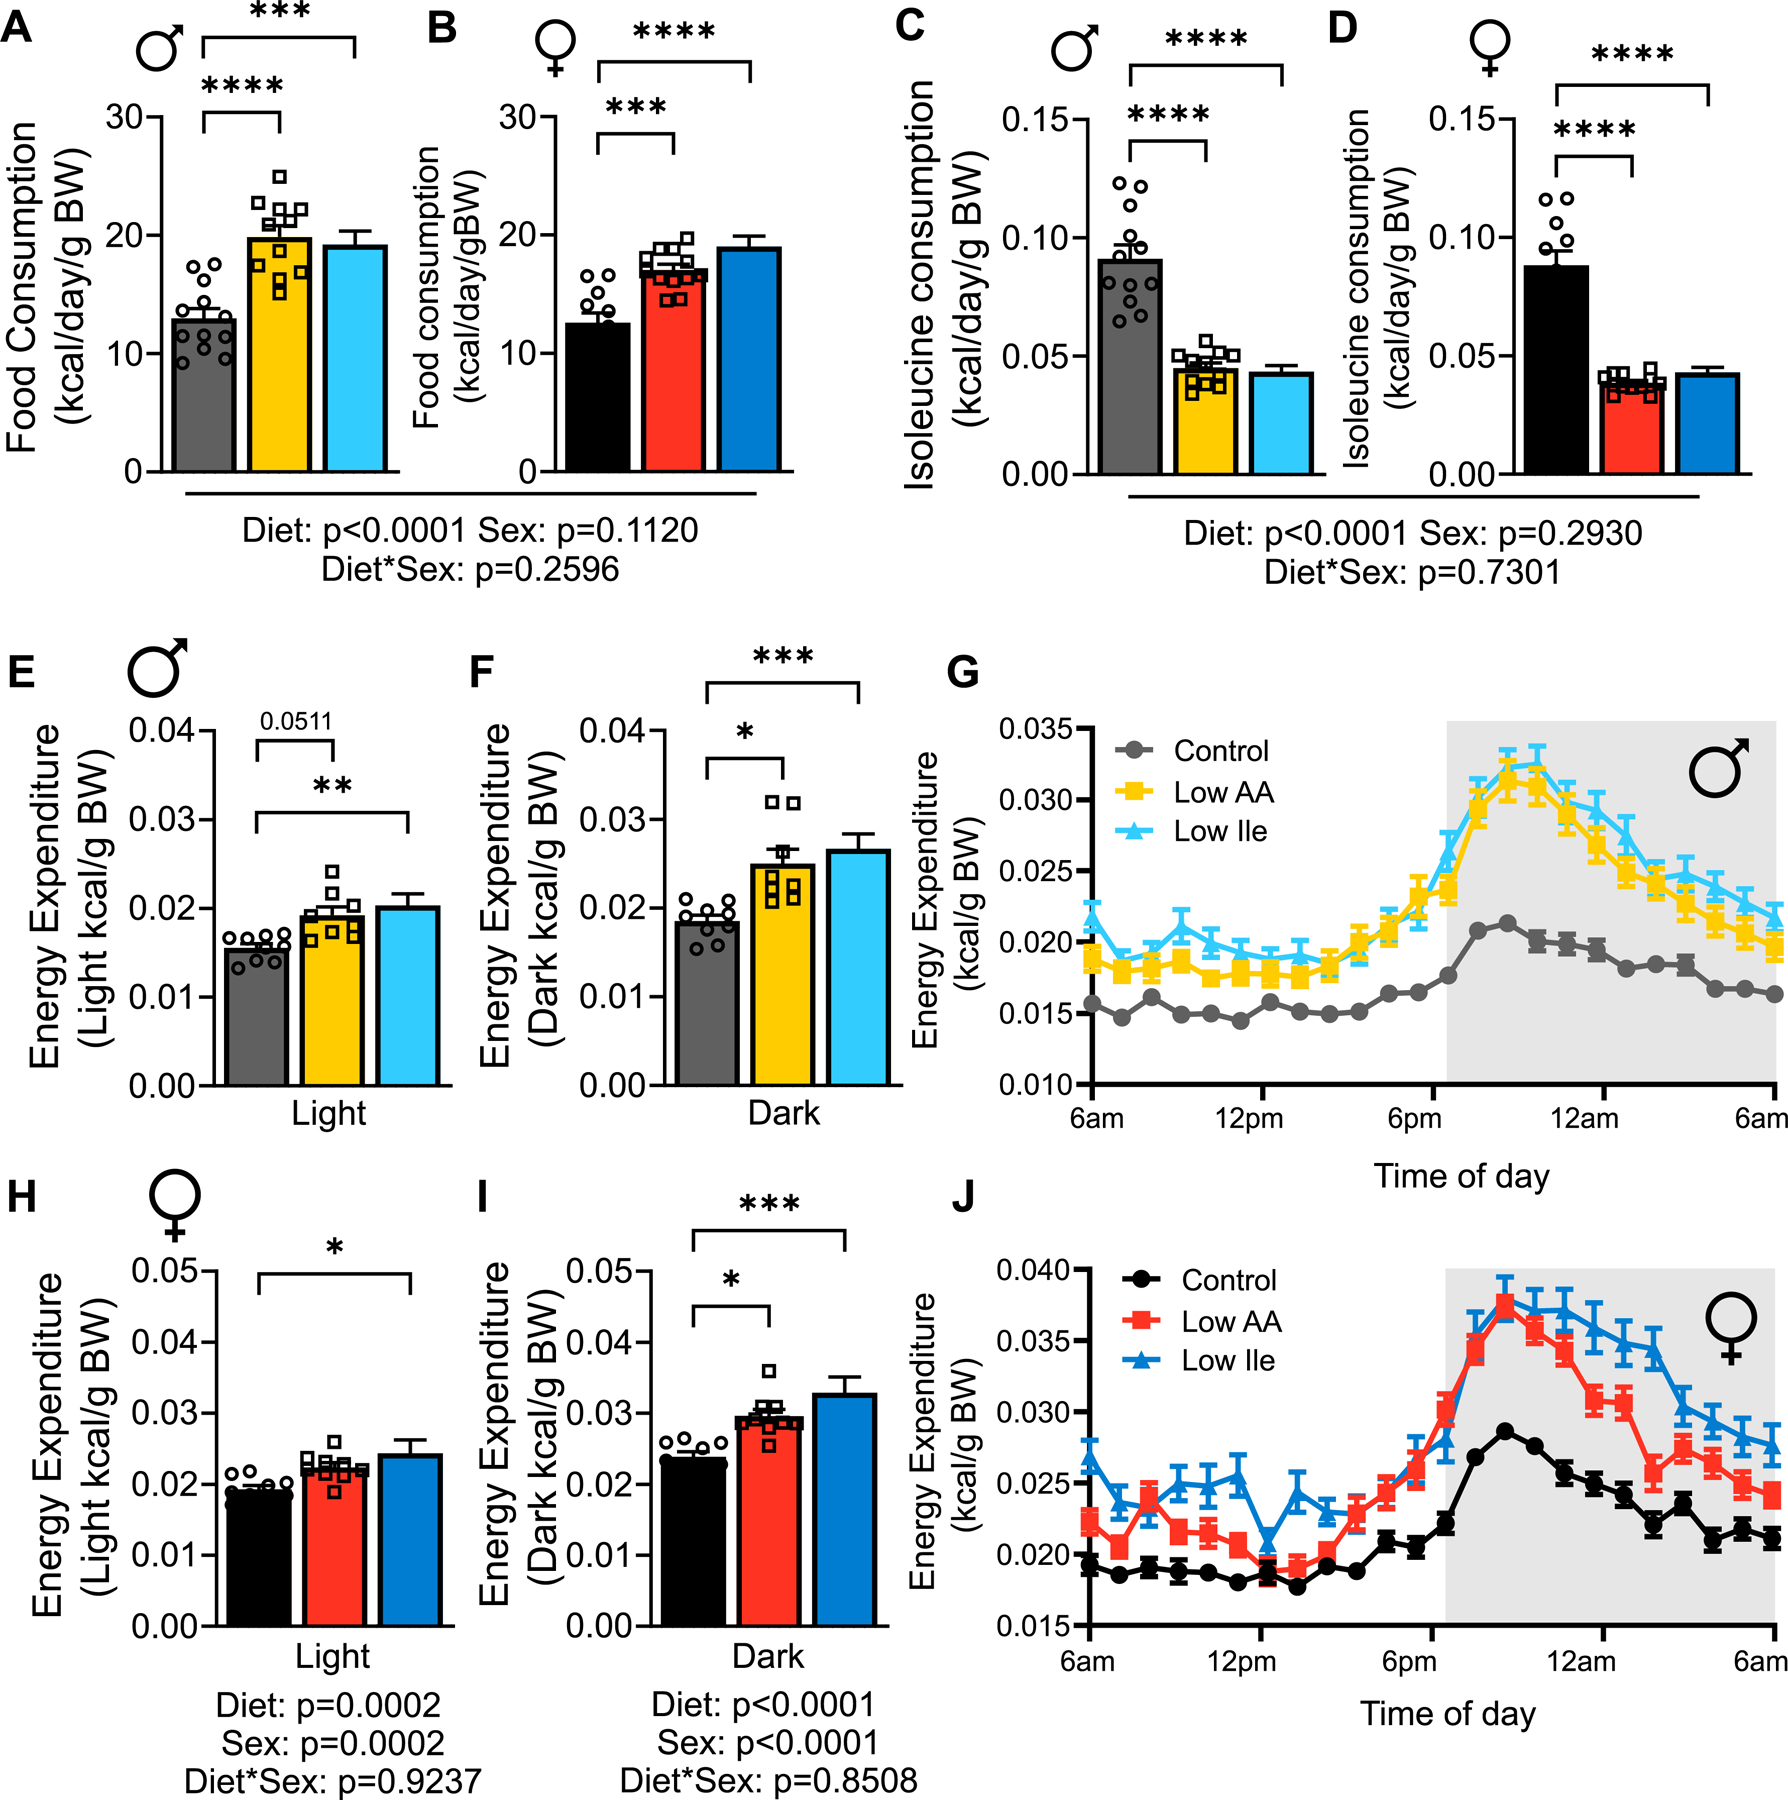
Figure 2: IleR alters energy balance in young HET3 mice.

(A-B) Daily food consumption was measured in home cages after 3 weeks on diet in males (A) and females (B). (C-D) Calculated daily isoleucine intake for males (C) and females (D). (A-D) n=11–12 mice/group. (E-J) Energy expenditure measure in males (E-G) and females (H-J); n=8–10 mice/group. (A-F, H-I) Tukey test following 2-way ANOVA, *P<0.05, **P<0.01, ***P<0.001 and ****P<0.0001. P-values for the overall effect of Diet, Sex and the interaction represent the significant p-values from the two-way ANOVA. Data represented as mean ± SEM. See also Figure S2.
