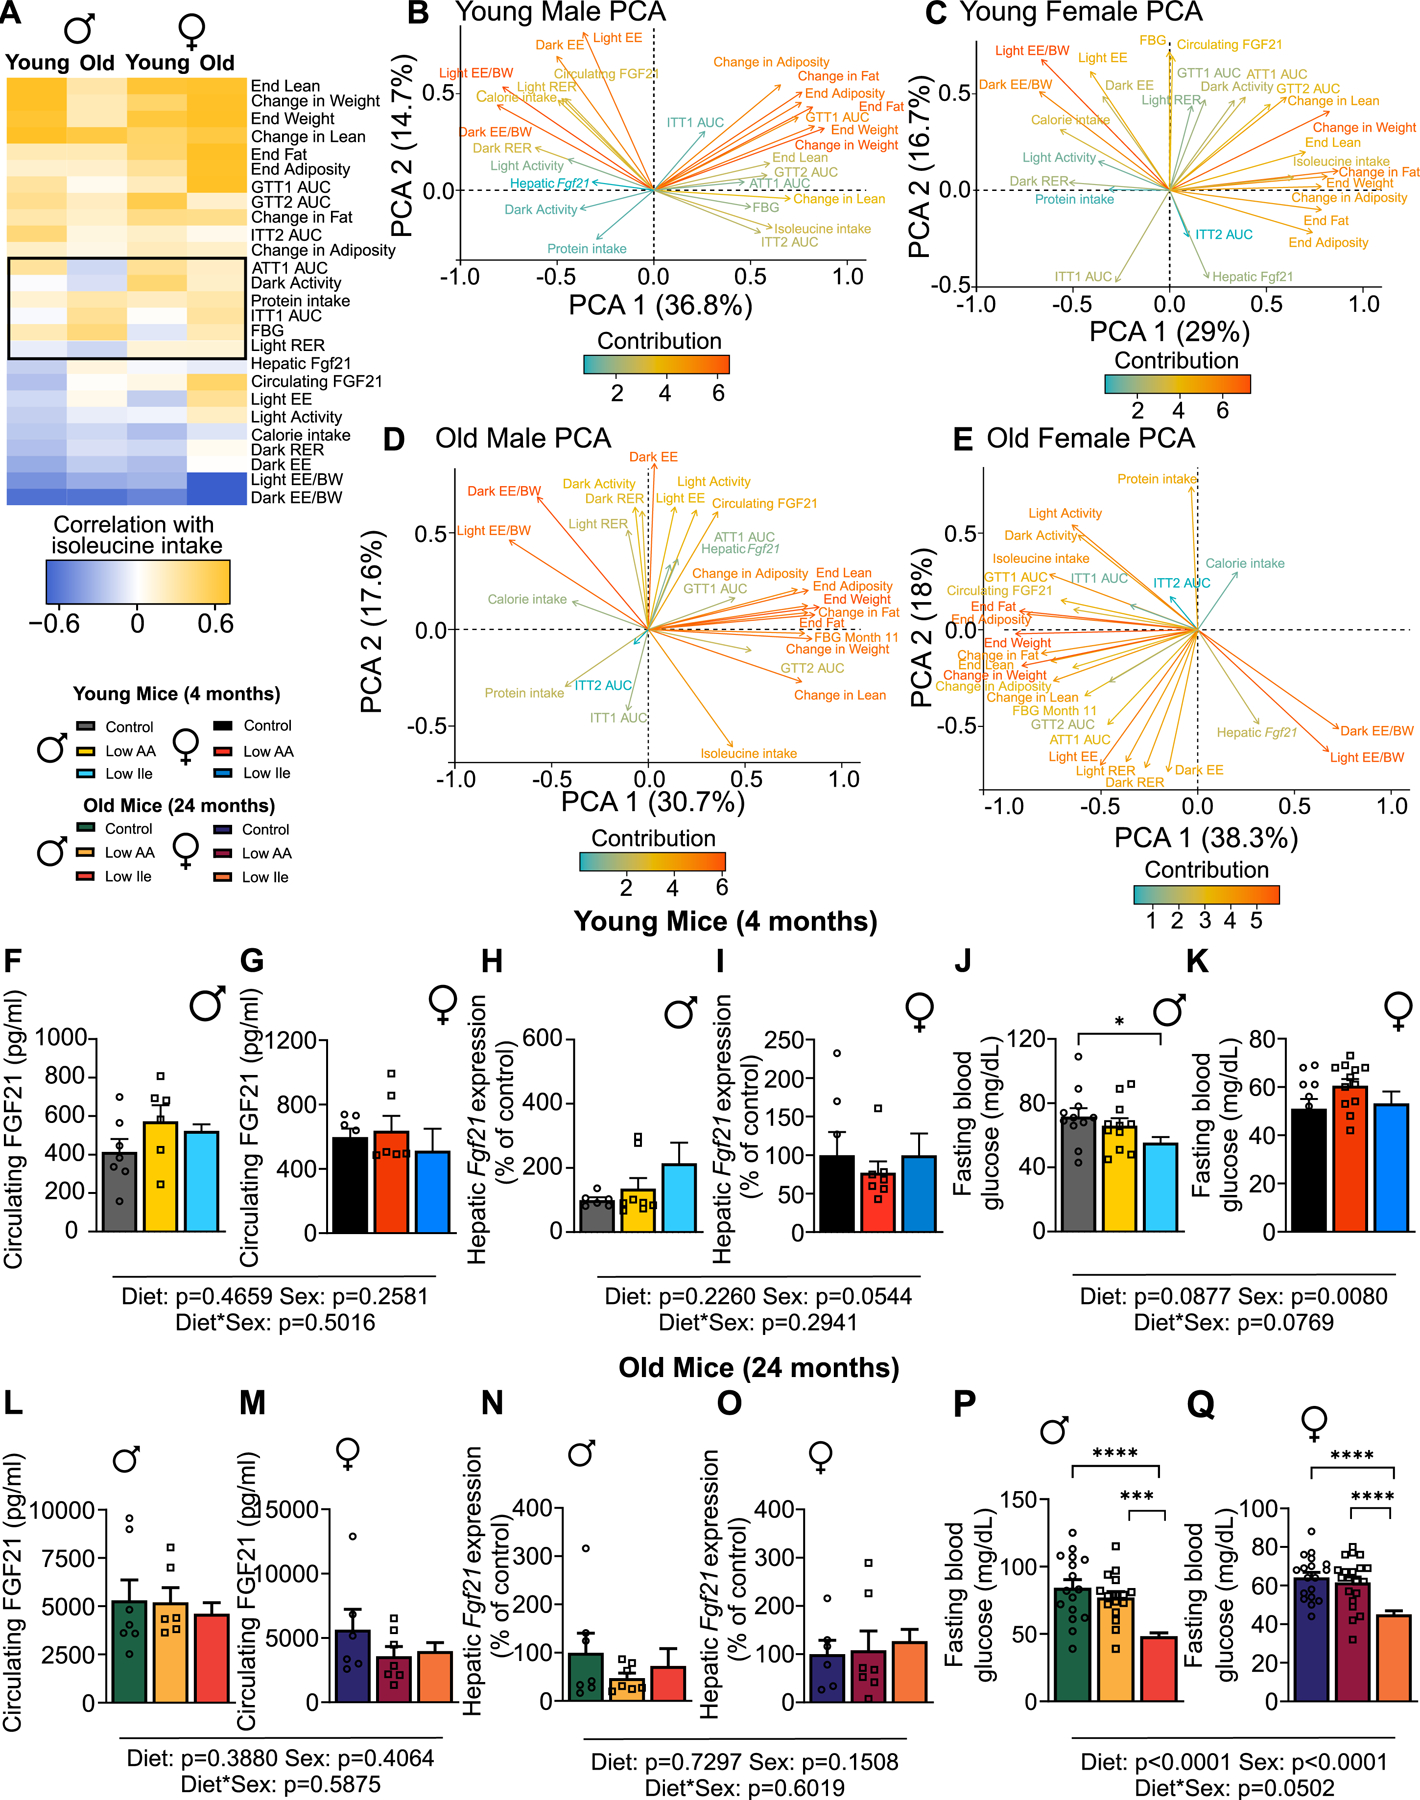
Figure 5: Correlation analysis identifies diet and age dependent and independent physiological and metabolic responses to a Low Ile diet.

(A) Phenotypic measurements correlated with consumption of isoleucine (kcals) in each mouse (Pearson’s correlation) and clustered (hierarchical clustering). Phenotypic measurements that do not cluster as well appear in the middle of the correlation plot surrounded by a black box. (B-D) Phenotypic measurements from PCA of young and old mice of both sexes were visualized; positively correlated variables point to the same side of the plot, negatively correlated variables point to opposite sides of the plot. Length and color of arrows indicate contribution to the principal components. Young n=11–12 mice/group, old n=17–22 mice/group. (F-Q) Selected phenotypic measurements. Circulating FGF21 n=6–7 mice/group, Hepatic Fgf21 n=6–8 mice/group, FBG n=11–21 mice/group. Tukey test following 2-way ANOVA; *P<0.05, **P<0.01, ***P<0.001 and ****P<0.0001. P-values for the overall effect of Sex, Diet and the interactions represent the significant p-values from the two-way ANOVA. Data represented as mean ± SEM. See also Table S2. See also Figure S5.
