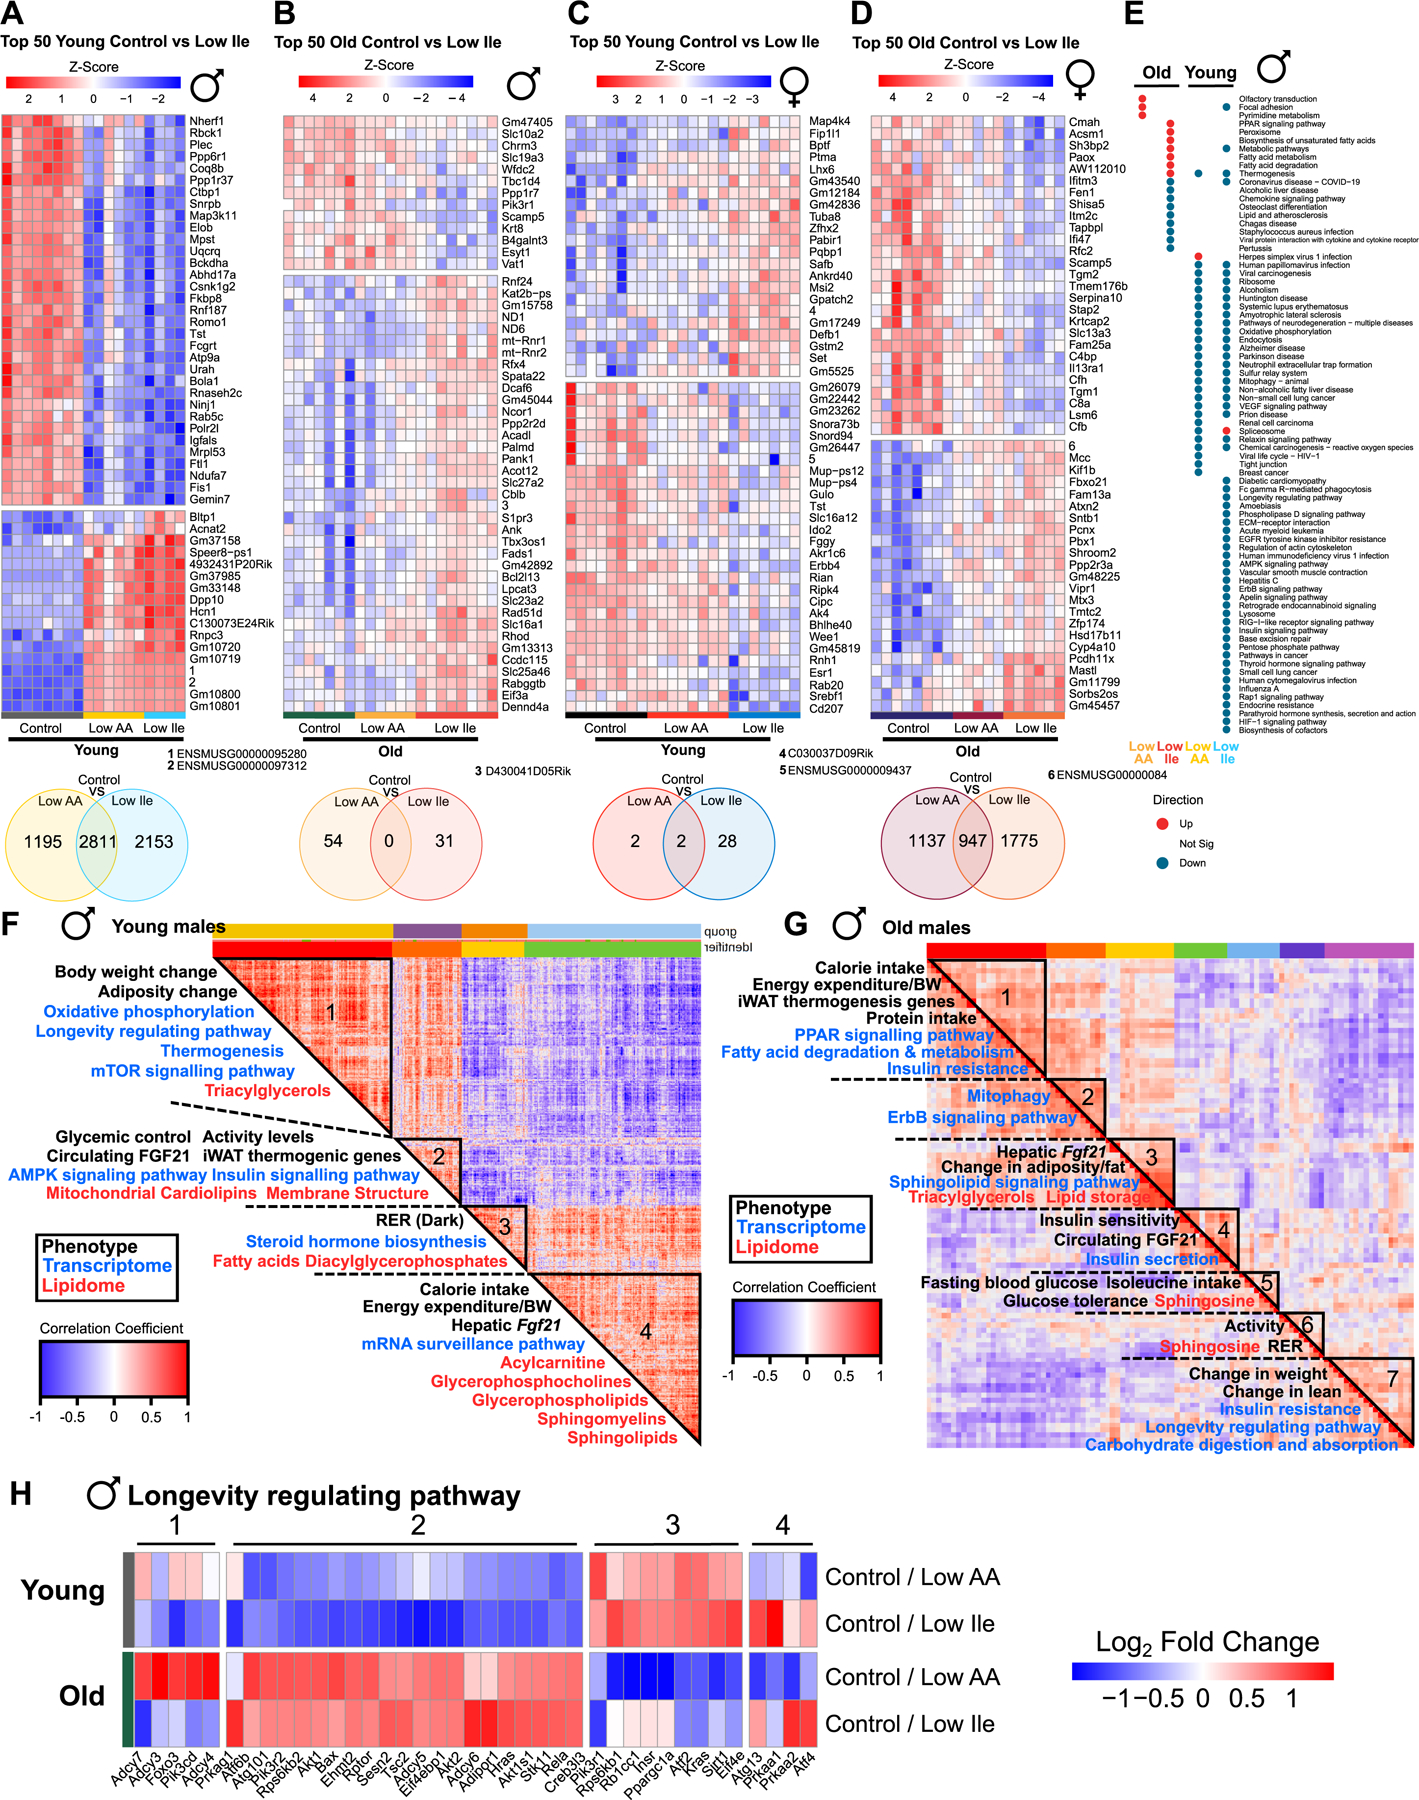
Figure 6: IleR and Low AA diets have sex- and age-dependent molecular impacts.

(A-D) Top 50 significantly differentially expressed (SDE) genes for the indicated comparisons, with hierarchical clustering across all groups in each figure. Venn Diagrams below each heatmap indicating significant gene overlap for the comparisons, unadjusted p<0.05. n=4–8 mice/group. (E) Enriched transcriptomic pathways across all male groups (red = upregulated, blue = downregulated, grey = not significant). n=6–8 mice/group. (F-G) Spearman’s rank order correlation matrix of phenotypic, transcriptomic, metabolomic and lipidomic changes across young (F) and old (G) male Control vs Low Ile mice. Mega-clusters identified by hierarchical clustering are outlined in black (Table S5D). N=6–8 mice/group. (H) Genes from KEGG “Longevity regulating pathway” significantly altered in old and young male mice on Low AA or Low Ile diets. n=6–8 mice/group. See also Tables S3A–S5D. See also Figure S6.
