Fig. 7.
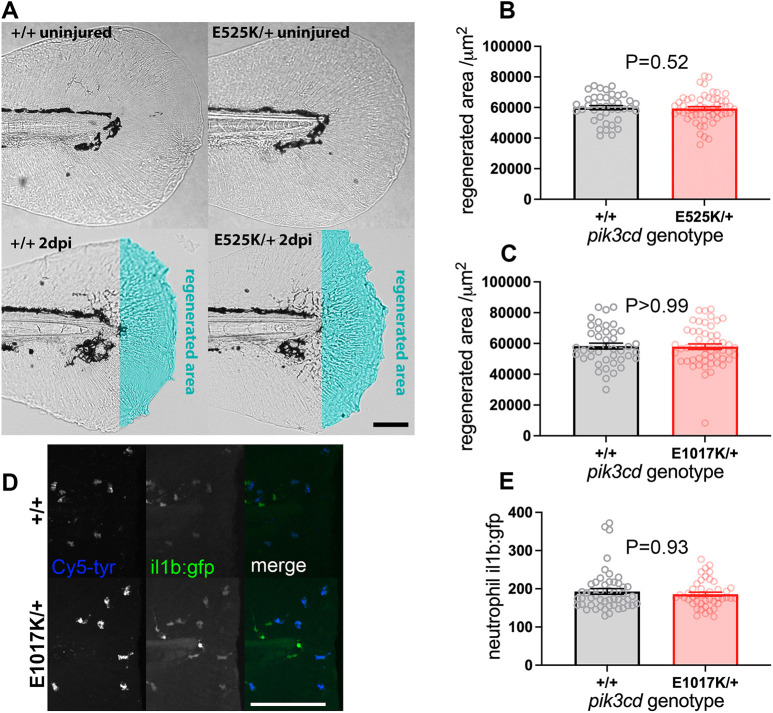
Tail-fin regeneration in pik3cdE525K/+ embryos. (A) Brightfield micrographs used to measure tail-fin regeneration for pik3cdE525K/+ embryos and their pik3cd+/+ siblings at 5 dpf, 2 days post injury (dpi). Top row shows uninjured controls. Transection was through the tip of the notochord. The regenerated area is illustrated with cyan false colour. Scale bar: 100 µm. (B) Chart of tail-fin regenerated area from micrographs as in A for 96 embryos. Bars show the mean±s.e.m., Mann–Whitney test. Data shown are from one experiment. A similar experiment using 5 dpf, 3 dpi larvae also detected no effect. (C) Chart of tail-fin regenerated area for pik3cdE1017K/+ embryos and their pik3cd+/+ siblings at 5 dpf, 2 dpi. Measured from micrographs of 96 embryos. Bars show the mean±s.e.m., Mann–Whitney test. Data shown are from one experiment. (D) Maximal-intensity projections of spinning disk confocal fluorescent micrograph stacks of 3 dpf TgBAC(il1b:EGFP)sh445;pik3cdE1017K/+ embryos and their pik3cd+/+ siblings, fixed and stained 3 h after tail transection. Fluorescence channels are shown for GFP and for endogenous peroxidase activity stain with Cy5-tyramide to identify neutrophils. Scale bar: 100 µm. (E) Chart of neutrophil TgBAC(il1b:EGFP)sh445 fluorescence intensity for single neutrophils at the injury site from each of 96 3 dpf sibling pik3cdE1017K/+ and pik3cd+/+ larvae, fixed and stained 3 h after tail transection as in D. Bars show the mean±s.e.m., Mann–Whitney test. Data shown are from one experiment.

