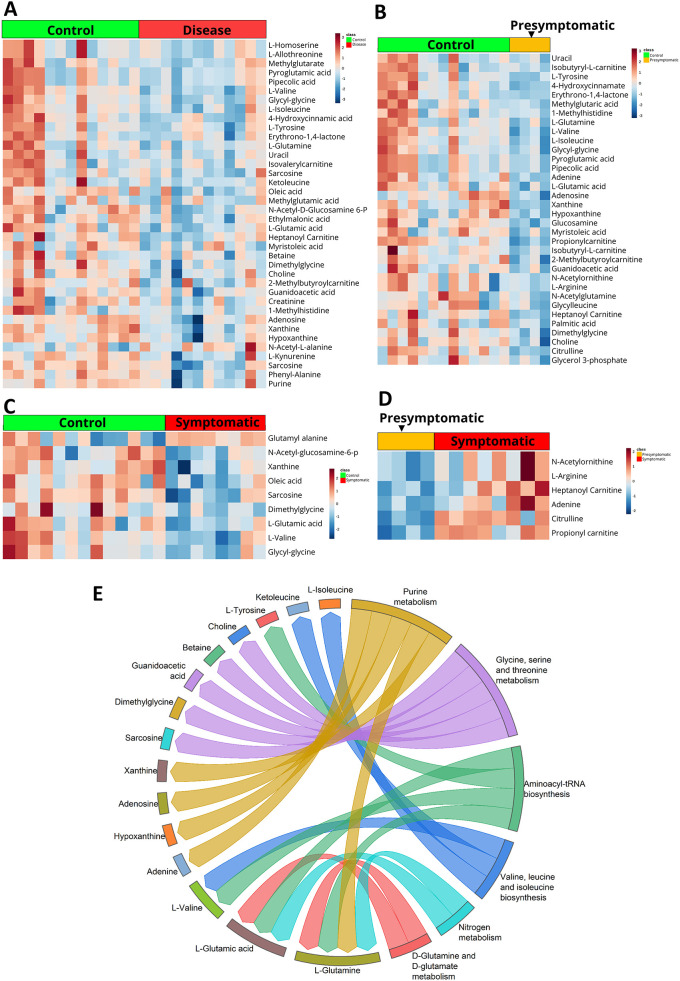
Fig. 1.
Human serum sample metabolomics. (A-D) Heatmaps representing the level of significantly altered metabolites at FDR≤0.25, control and disease (A), control and asymptomatic patients (B), control and symptomatic patients (C) and asymptomatic and symptomatic patients (D). (E) Plotted are the results of the metabolite set enrichment analysis (MSEA), showing the link between significantly altered metabolites and six metabolic pathways they impact on, when comparing HD patient and control samples. Pathways were considered to be significantly enriched at a false discovery rate (FDR) value of ≤0.25.

