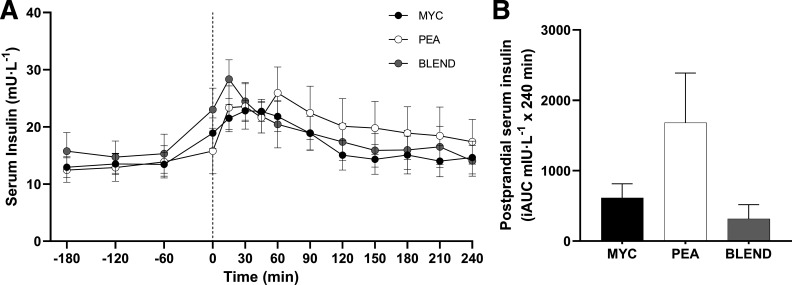
Figure 2.
Time course (A) and incremental area under the curve (iAUC; B) (calculated as above postaborptive values) of serum insulin concentrations for a 3-h postabsorptive period (time course only) and a 4-h postprandial period in healthy resistance-trained men. The dashed vertical line represents drink consumption [46.7 g of mycoprotein containing 25 g of protein (MYC; n = 11), 31.7 g of pea protein containing 25 g of protein (PEA; n = 11), or 36.9 g of mycoprotein/pea protein blend (39/61%) containing 25 g of protein (BLEND; n = 11)], following a bout of whole body resistance exercise. Time course data were analyzed using a two-way repeated-measures ANOVA (group × time) with Sidak post hoc tests used to detect differences at individual time points. iAUC data were analyzed using a one-way ANOVA. Time effect; P < 0.0001. Group effect; P > 0.05. Group × time interaction; P > 0.05. Values are represented as means ± SE.

