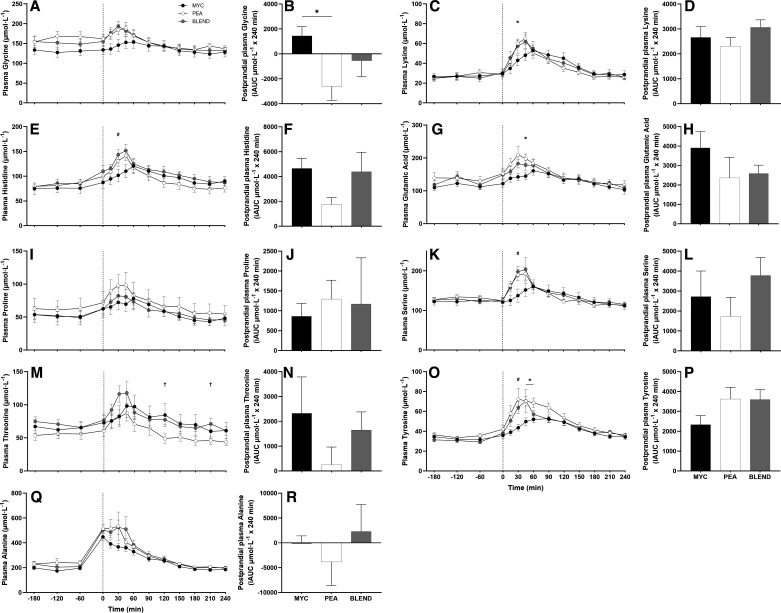
Figure 5.
Time course and incremental area under the curve (iAUC; calculated as above postaborptive values) of plasma glycine (A and B), lysine (C and D), histidine (E and F) glutamic acid (G and H), proline (I and J), serine (K and L), threonine (M and N), tyrosine (O and P), and alanine (Q and R) over a 3-h postabsorptive period (time course only) and 4-h postprandial period in healthy resistance-trained men. The dashed vertical line represents drink consumption [46.7 g of mycoprotein containing 25 g of protein (MYC; n = 11), 31.7 g of pea protein containing 25 g of protein (PEA; n = 11), or 36.9 g of mycoprotein/pea protein blend (39/61%) containing 25 g of protein (BLEND; n = 11)], following whole body resistance exercise. Time course data were analyzed using a two-way repeated-measures ANOVA (group × time) with Sidak post hoc tests used to detect differences at individual time points. iAUC data were analyzed using a one-way ANOVA. *Individual differences between MYC and PEA at that time point and a difference between conditions on the bar graphs (P < 0.05). #Individual differences between MYC and BLEND at that time point (P < 0.05). †Individual differences between PEA and BLEND at that time point (P < 0.05). Time effect; all P < 0.0001. Group effect; all P > 0.05. Time × group interaction; all P < 0.05 with exception of proline and alanine. Values are represented as means ± SE.

