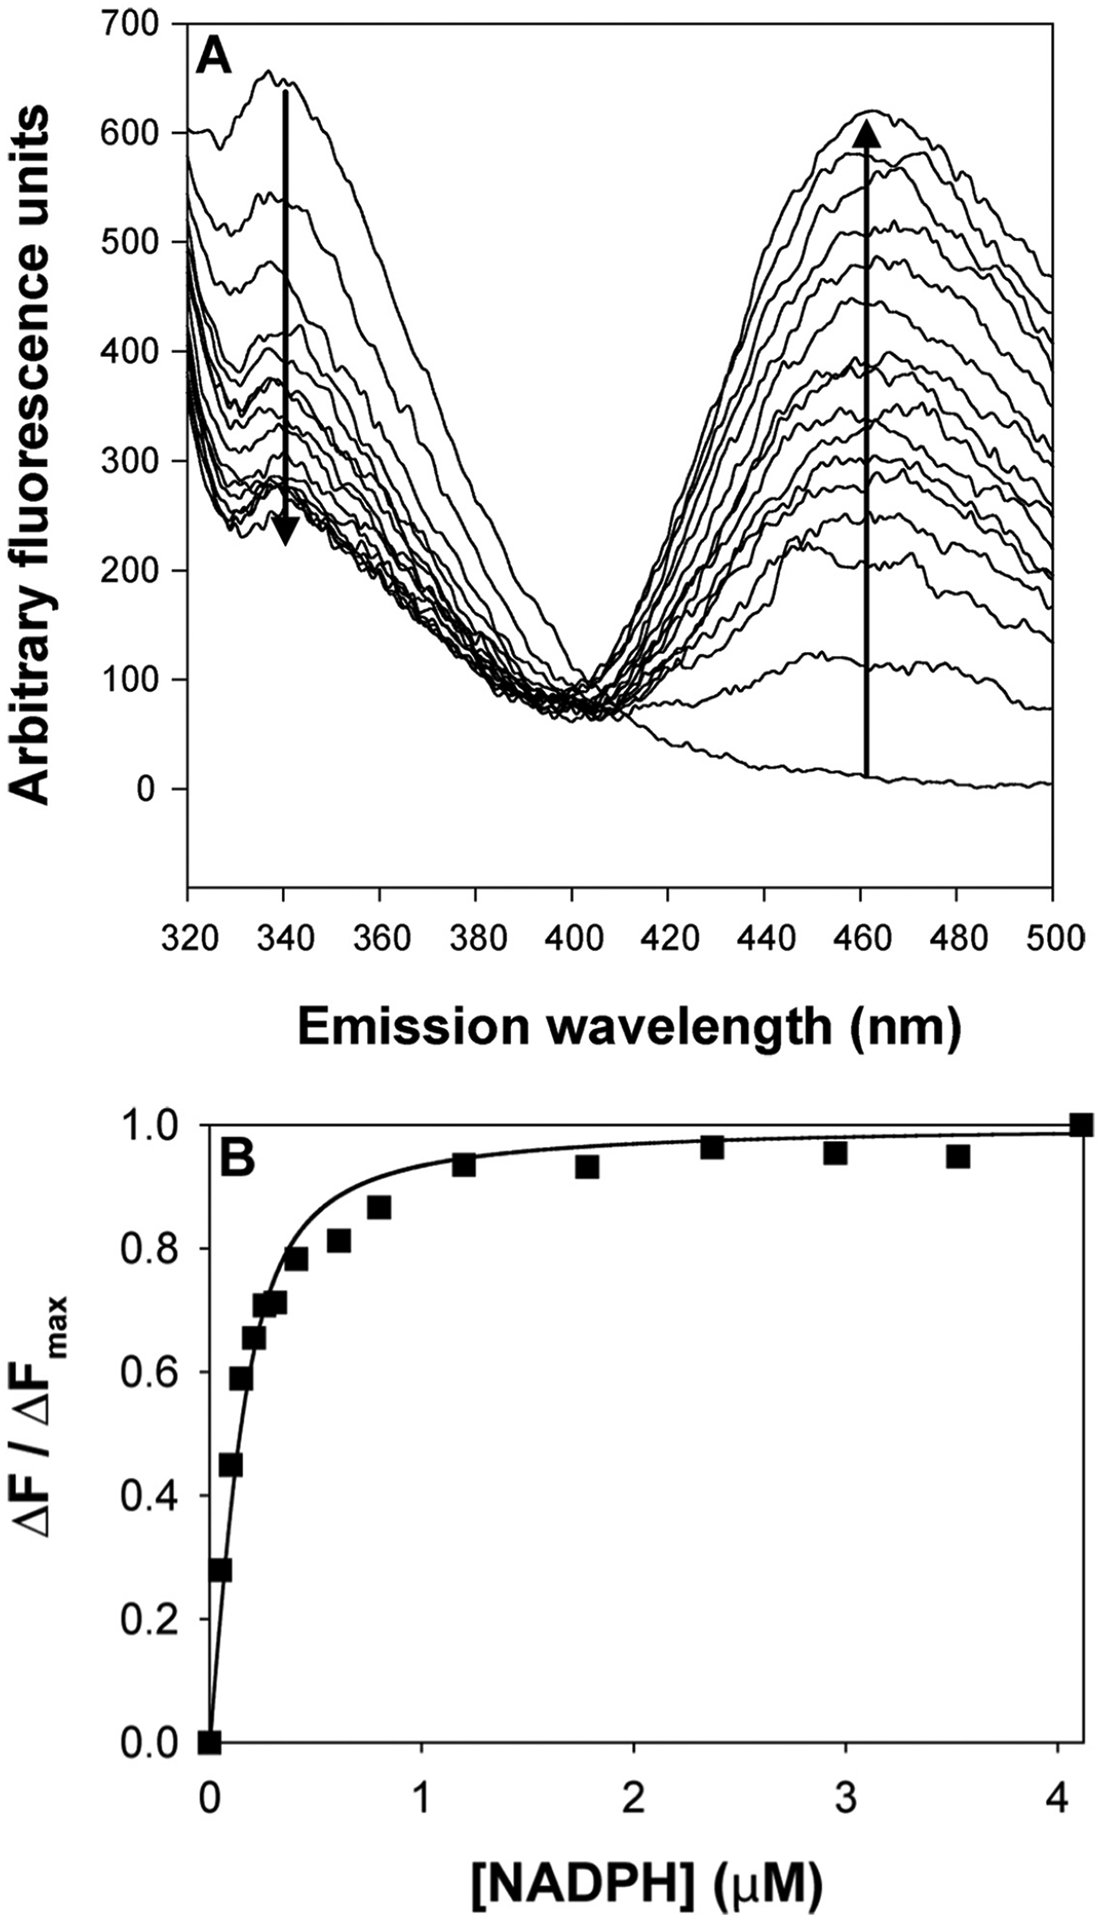
Fig. 4.

Titration of the fluorescence emission spectra of AKR1D1 with increasing [NADPH]. (Panel A) Emission spectrum of recombinant AKR1D1 excited at 295 nm following the addition of increasing concentrations of NADPH from 0 to 4 μM. A decrease in emission is seen at 340 nm and an increase in emission is seen at 460 nm with an isosbestic point at 405 nm. (Panel B) Plot of ΔF/ΔFmax versus [NADPH], wild type (■). This research was originally published in the Journal of Biological Chemistry. Drury et al., (2010).
