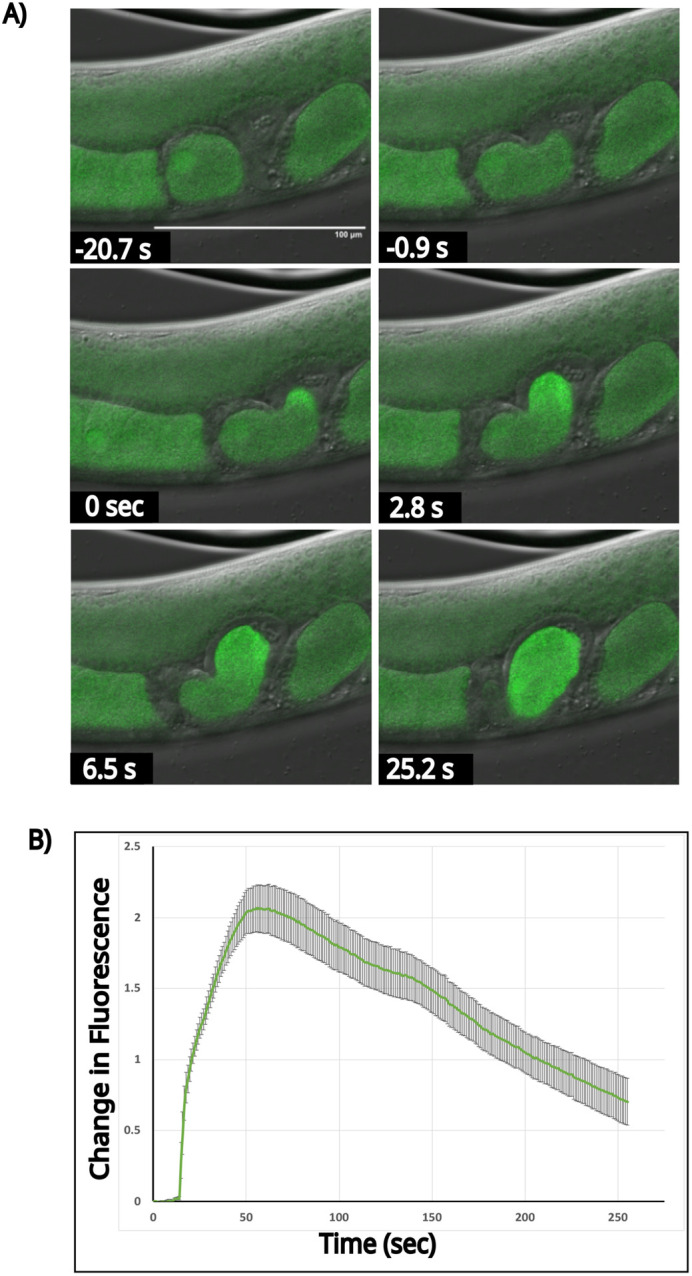
Fig. 2.

Visualization of the biphasic nature of the calcium wave during fertilization. (A) Time-lapse images of the calcium wave during fertilization. Time 0 was taken as the first frame showing a visible increase in fluorescence in the oocyte. Scale bar: 100 µm. (B) Quantitation of the change in fluorescence [(F1-F0)/F0)] over a region of interest encompassing the path of the oocyte during ovulation for a representative fertilization event shown above. The x-axis is time in seconds. The average intensity was plotted. Standard deviation is shown. Signals were normalized to the 15th frame before fertilization. n=7.
