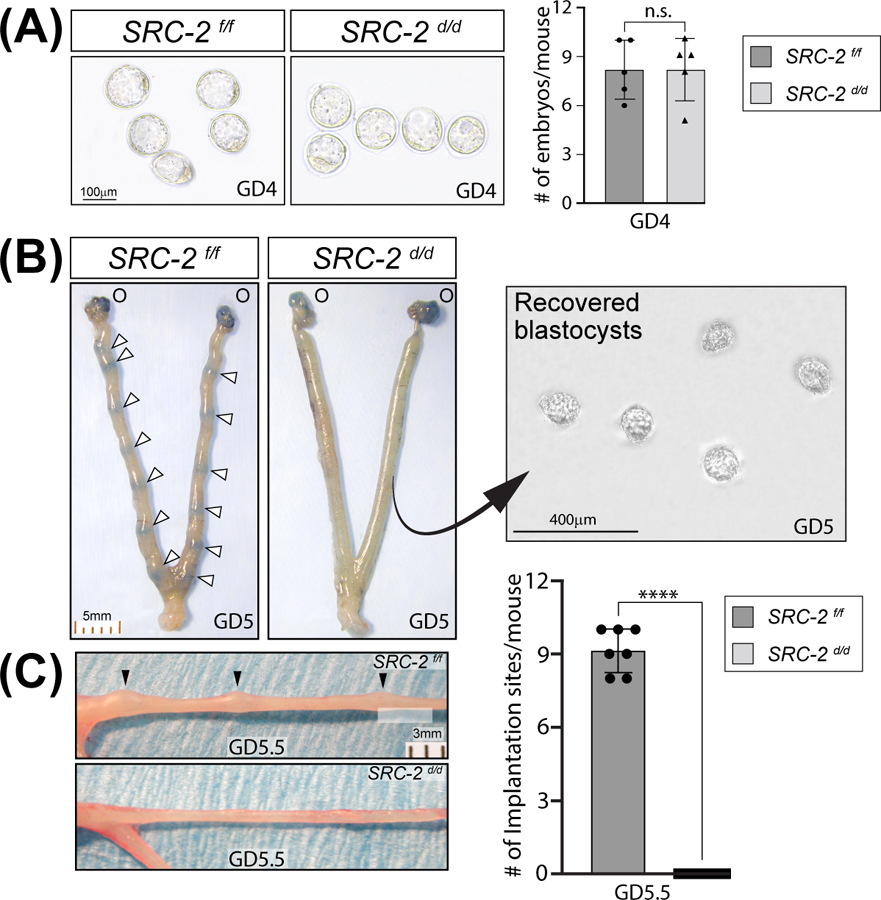
FIGURE 1.

Embryo implantation is blocked in the SRC-2 d/d mouse. (A) An equivalent number of preimplantation blastocysts are produced by the SRC-2 f/f and SRC-2 d/d at GD4 (n = 5 mice per genotype); n. s. denotes not significant. (B) Tail vein injection of Chicago sky blue dye reveals the expected number of implantation sites in the SRC-2 f/f at GD5 (denoted by white arrowheads (O indicates the location of the ovaries)); the scale bar applies to both panels. The similarly treated SRC-2 d/d female does not show blue banding along the uterine horn as seen in the SRC-2 f/f control. The right panel shows recovered blastocysts from flushing one uterine horn of the SRC-2 d/d mouse at GD5; the result is representative of five mice. (C) By GD5.5, implantation sites can be visually detected (without the need for staining) along one of the two uterine horns of the SRC-2 f/f mouse at GD5.5 (top panel (black arrowheads)) whereas implantation sites are not present in the uterine horn of the SRC-2 d/d mouse (bottom panel); scale bar in the top panel applies to both panels. The histogram on the right graphically displays the number of implantation sites for each genotype at GD5.5 (n = 7 mice per genotype).
