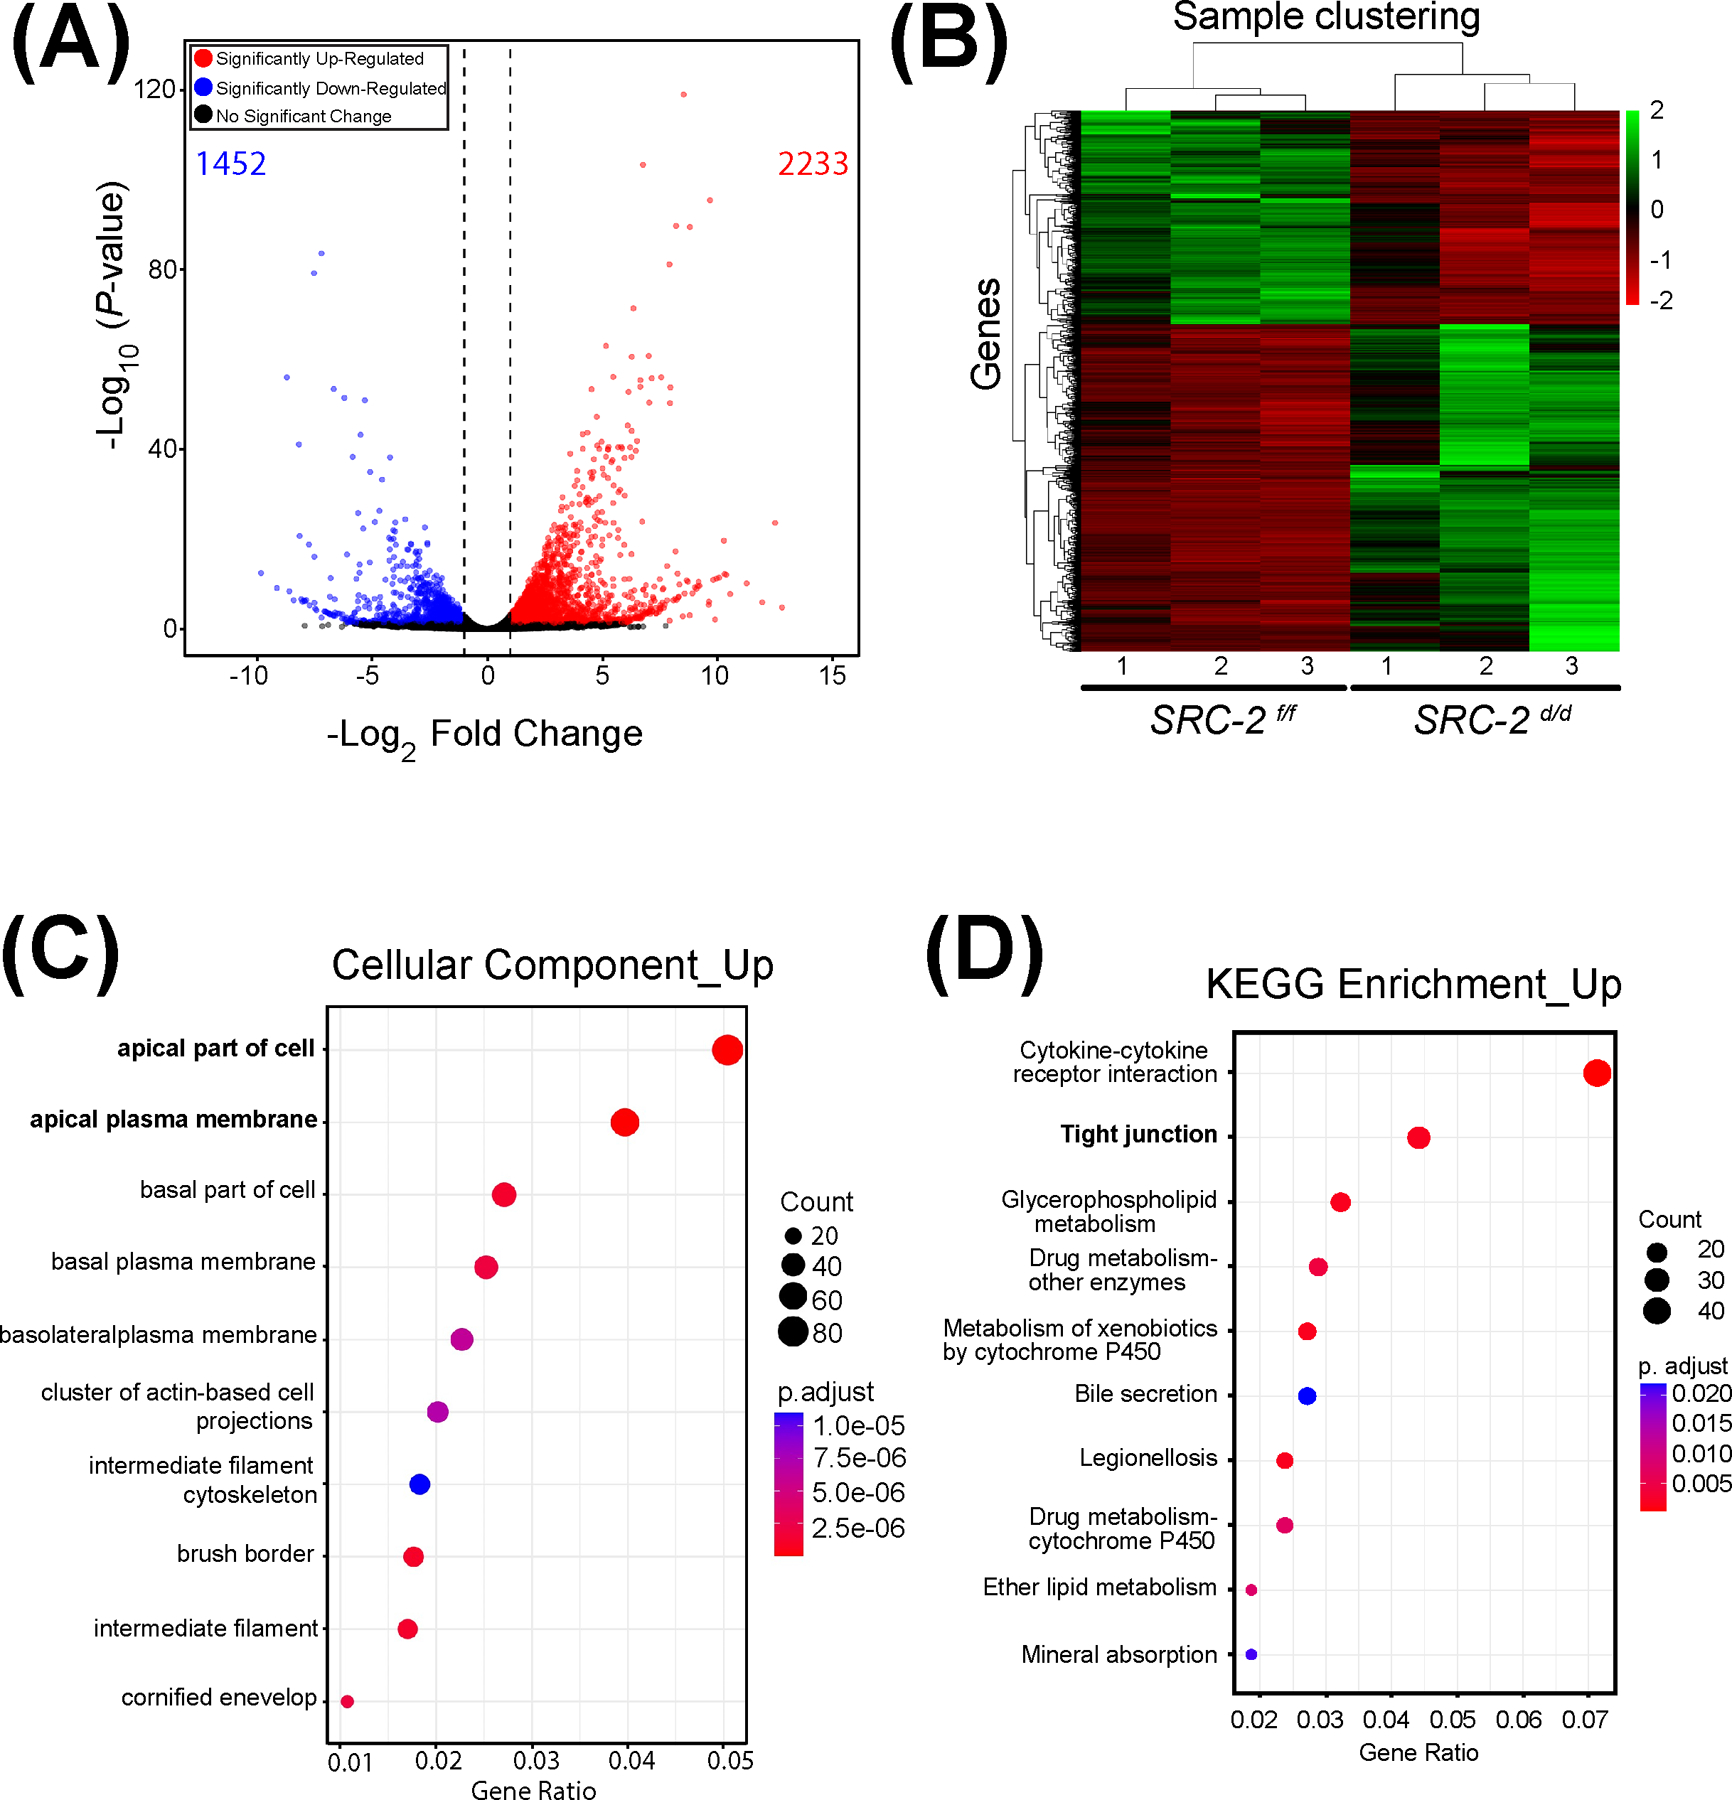
FIGURE 4.

Genome-wide alteration of the transcriptome in the SRC-2 d/d uterus at GD5. (A) The volcano plot graphically displays the total number of genes differentially expressed between the SRC-2 f/f and SRC-2 d/d groups. Significance (p-value) versus fold change are plotted on the y- and x-axis respectively. The total number of genes differentially expressed between the two groups is 3,685 (1,452 and 2,233 downregulated and upregulated respectively). (B) The heatmap represents an unsupervised hierarchical clustergram of the total number of genes differentially expressed between the SRC-2 f/f and SRC-2 d/d groups that reached FDR and FC thresholds of ≤ 0.05 and ≥ 2 respectively. Each row represents a gene while each column denotes a sample replicate in the SRC-2 f/f or SRC-2 d/d group; the dendrogram on both axes show the arrangement of the clusters following analysis. The intensity of the color indicates the level of expression for each gene in the sample replicate. (C) Dot plot of enriched genes within the DEG dataset are stratified according to biological processes, the cellular component module is shown. Note apical and basolateral plasma membrane properties feature prominently in this analysis. (D) The KEGG analysis shows enrichment for tight junction biology (bold) for proteins encoded by genes for which expression is significantly changed between the SRC-2 f/f and SRC-2 d/d groups.
