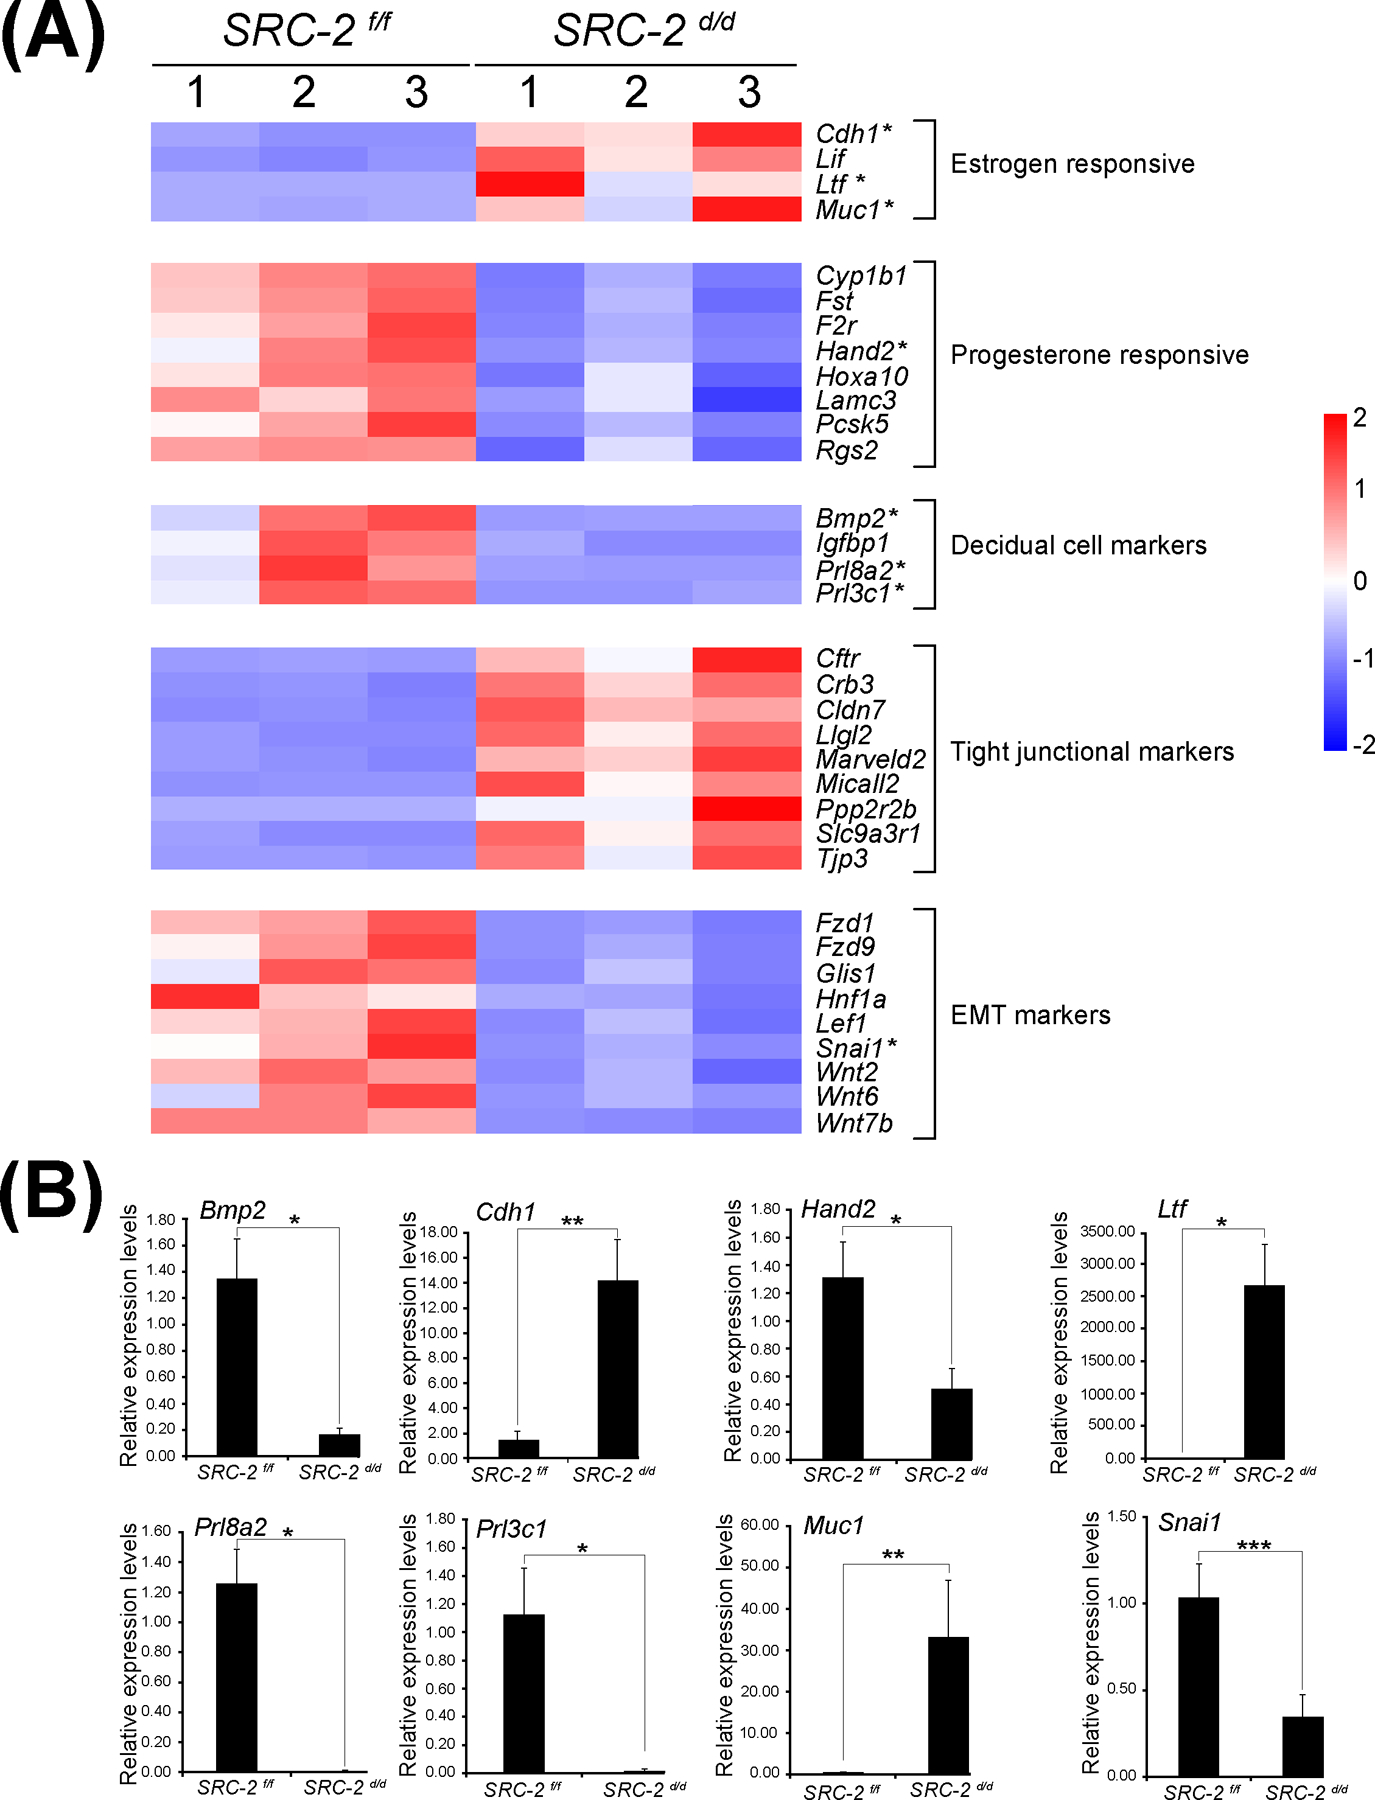
FIGURE 5.

Aberrant expression of genes in the SRC-2 d/d uterus that are involved in uterine receptivity. (A) Heat map of gene expression changes between the SRC-2 f/f and SRC-2 d/d replicates predict an increase in the expression of estrogen responsive genes (Cadherin 1 (Cdh1); Leukemia inhibitory factor (Lif); Lactoferrin (Ltf); and Mucin 1 (Muc1)), a decrease in expression of progesterone responsive genes (Cytochrome P450 family 1 subfamily B member 1 (Cyp1b1); Follistatin (Fst); Coagulation F2 receptor (F2r); Heart and neural crest derivatives expressed 2 (Hand2); Homeobox A10 (Hoxa10); Laminin subunit gamma 3 (Lamc3); Proprotein convertase subtilisin kexin type 5 (Pcsk5); Regulator of G protein signaling 2 (Rgs2)), a decrease in expression of established decidual cell markers (Bone morphogenetic protein 2 (Bmp2); Insulin-like growth factor binding protein 1 (Igfbp1); Prolactin family 8, subfamily a, member 2 (Prl8a2); and Prolactin family 3, subfamily C, member 1 (Prl3c1)), an increase in expression of tight junctional markers (Cystic fibrosis transmembrane conductance regulator (Cftr); Crumbs cell polarity complex component 3 (Crb3); Claudin 7 (Cldn7); Lorelei-like-GPI-anchored protein 2 (Llg2); Marvel domain containing 2 (Marveld2); Molecule interacting with casl-like 2 (Micall2); Protein phosphatase 2, regulatory subunit B, beta (Ppp2r2b); Solute carrier family 9, member 3, regulator 1 (Slc9a3r1); and (Tight junction protein 3 (Tjp3)), and a decrease in expression of EMT markers (Frizzled class receptor 1 (Fzd1); Frizzled class receptor 9 (Fzd9); Glis family zinc finger 1 (Glis1); Hepatocyte nuclear factor 1 alpha (Hnf1a); Lymphoid enhancer binding factor 1 (Lef1); Snail family transcriptional repressor 1 (Snai1); Wnt family member 2 (Wnt2); Wnt family member 6 (Wnt6); and Wnt family member 7b (Wnt7b)). Asterisks denote genes chosen for further expression validation by qPCR shown below. (B) Quantitative real time PCR results for a selection of genes with asterisks listed in the heat maps shown in panel (A). Important to note: the RNA samples used in these quantitative real time PCR experiments were separate from the RNA samples used for the RNA-seq study; n= 3 per genotype.
