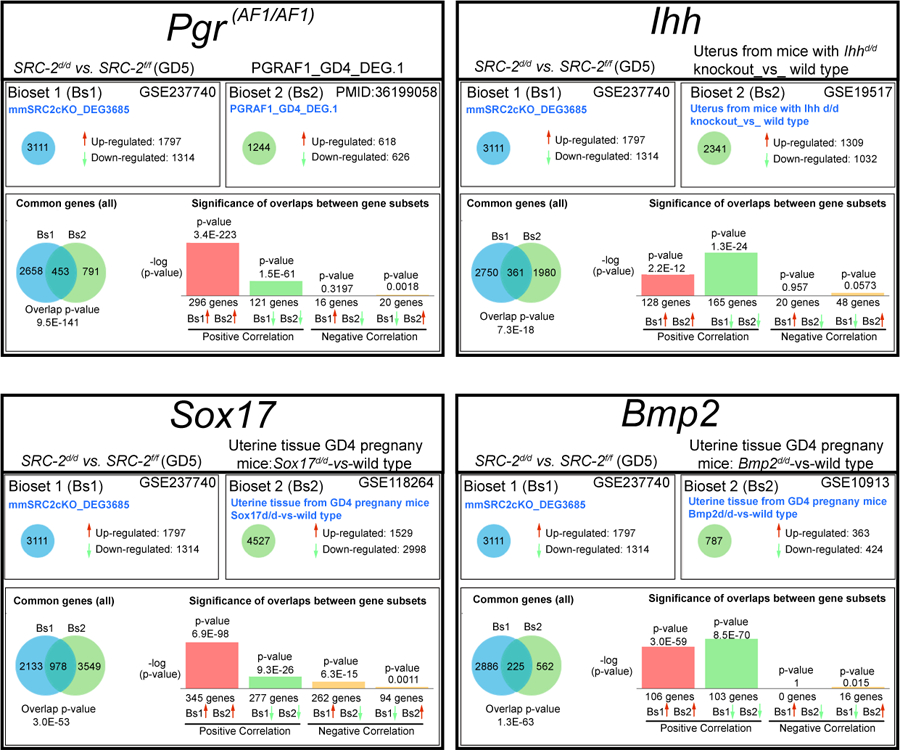
FIGURE 6.

Significant correlation in the expression of a gene subset in the SRC-2 d/d versus SRC-2 f/f DEG dataset and in uterine DEG datasets from mutant mouse exhibiting progesterone suppression and concomitant estrogen hypersensitivity. The Illumina correlation engine was used to determine the significance of positive correlation in gene expression changes (up (red histogram) and down (green histogram)) between gene subsets in the SRC-2 d/d vs SRC-2 f/f DEG dataset and in DEG datasets reported for uterine tissue from four mutant mouse models that exhibit a progesterone suppression and estrogen hypersensitivity phenotype 42, 44–46.
