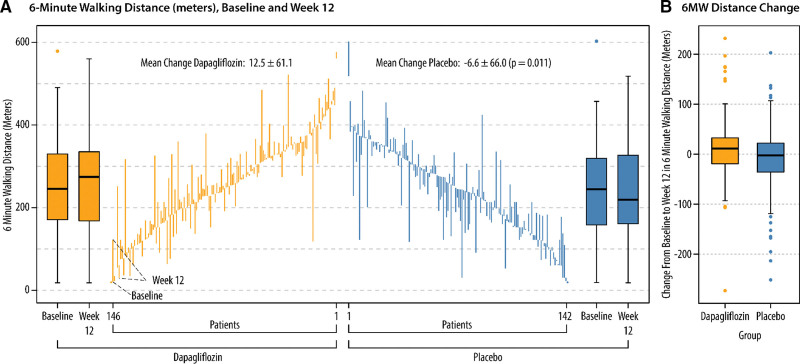
Figure 2.
Baseline values and changes in 6-minute walk test (6MWT) distance. Baseline 6MWT distance values and week 12 peak 6MWT distance values are shown for individual patients receiving dapagliflozin (gold) vs placebo (blue) in A. Changes in 6MWT distance (medians and interquartile ranges [IQRs]) in meters from baseline to week 12 are shown in B. Box edges indicate the IQRs. Horizontal lines between the edges indicate the medians. Whiskers extend to the upper and lower adjacent values, and dots represent outside values.

