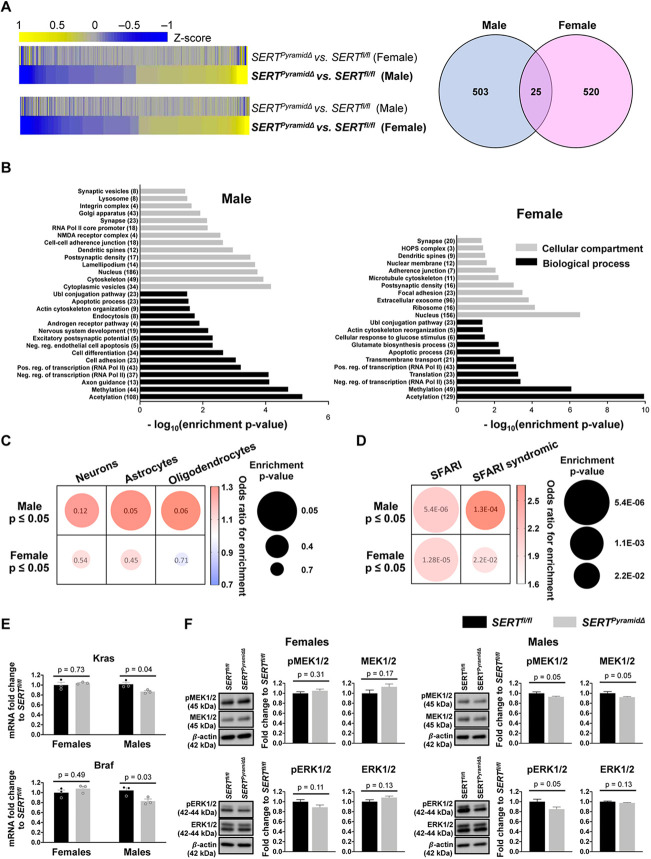
Fig. 6.
Sex-biased transcriptional dysregulation in SERTPyramidΔ hippocampus age P7. (A) Left, anchored heatmaps comparing SERTPyramidΔ-dependent differential gene expression profiles in P7 dorsal hippocampus in the two sexes (DEGs based on P≤0.05, n=3/group; each n was pooled dorsal hippocampal tissues from four mice, a total of 48 mice for the entire cohort). Normalized RNA expression values (averaged between replicates) were used to generate z-scores for each row. Right, Venn diagram displaying low overlap between DEGs in male and female SERTPyramidΔ mice versus sex-matched controls. (B) Gene Ontology for DEGs in P7 male and female SERTPyramidΔ dorsal hippocampus. Gray bars indicate GO terms categorized by cellular compartments; black bars indicate GO terms categorized by biological processes. The number of DEGs matching each category is indicated in parentheses. DEGs were based on P≤0.05. (C,D) Distinct enrichments of male and female SERTPyramidΔ hippocampal DEGs for cell type-specific markers (C), and for ASD-associated and ASD-syndromic genes curated by the SFARI database (D). Circle size indicates Fisher's exact test P value for the enrichment, and color indicates the odd ratio for the enrichment. DEGs were based on P≤0.05. (E) RT-qPCR analyses of Kras and Braf mRNA levels in dorsal hippocampus of P7 male and female SERTPyramidΔ versus SERTfl/fl mice. n=3/group; each n was pooled dorsal hippocampal tissues from four mice. Data are mean±s.e.m, two-way ANOVA followed by Šidák post-hoc test. Kras sex effect: F1,8=4.425, P=0.0685. Kras genotype X sex interaction: F1,8=6.349, P=0.0358. Braf sex effect: F1,8=4.324, P=0.0712. Braf genotype X sex interaction: F1,8=8.677, P=0.0185. (F) Immunoblotting quantification for pMEK1/2, MEK1/2, pERK1/2 and ERK1/2 in P7 dorsal hippocampal tissue from SERTPyramidΔ versus sex-matched SERTfl/fl mice. n=6 mice/sex/genotype, data are mean±s.e.m. two-tailed t-test.

