Figure 2.

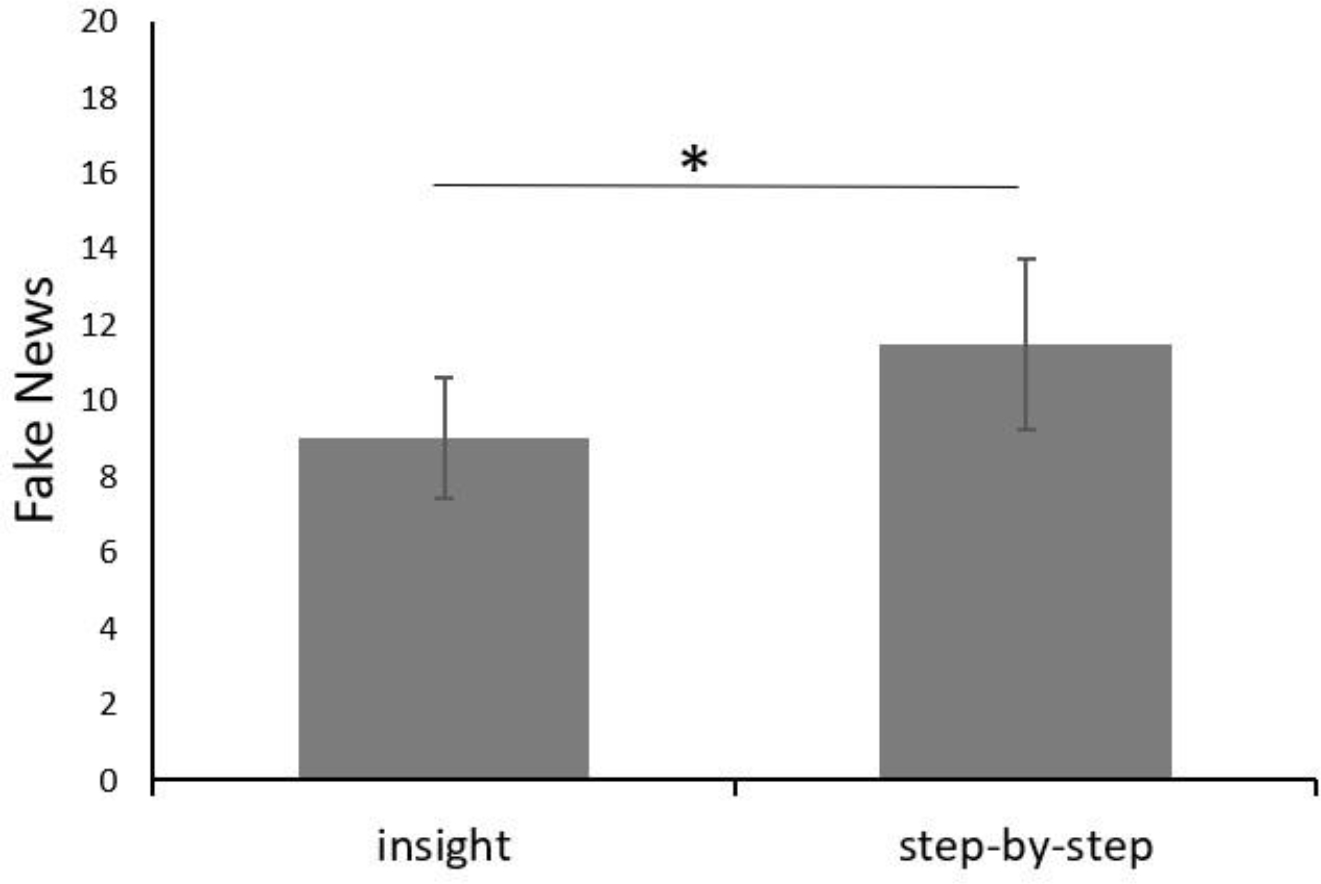
Graph indicating the significant difference in the number of fake news stories participants in the insight and step-by-step analysis groups believed in. Error bars represent standard deviation.

Graph indicating the significant difference in the number of fake news stories participants in the insight and step-by-step analysis groups believed in. Error bars represent standard deviation.