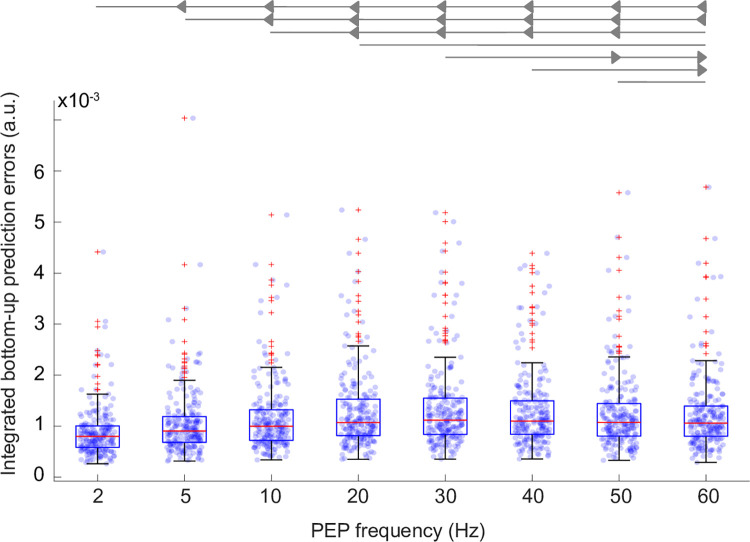
Fig 3. Sensory information integration efficacy—Precoss-β-full.
We quantified how the modulation frequency of the PEP affects the model’s ability to integrate sensory information about syllable identity. The Friedman test indicated that the modulation frequency affected the amount of informative signal propagated up in the model hierarchy. Pairwise comparisons were made for each frequency pair (S12 Table). The Bonferroni procedure was used to control for multiple comparisons. The measure of the integration of sensory information peaked at 30 Hz, with statistically significant (p<0.05 corrected) differences from all other frequencies except 20 and 40 Hz. Each point on the scatter plot represents the measured value for each sentence at the corresponding PEP frequency. The scatter plots are overlayed with boxplots; the central red marker corresponds to the median, the lower and upper edges represent the 25th and 75th percentiles, and red crosses indicate outliers, while whiskers extend to the highest and lowest performance values that are not considered outliers. Arrows at the top indicate (following the convection described in [97]) a significant difference and direction of effect (left or right arrow) between the frequencies compared.

