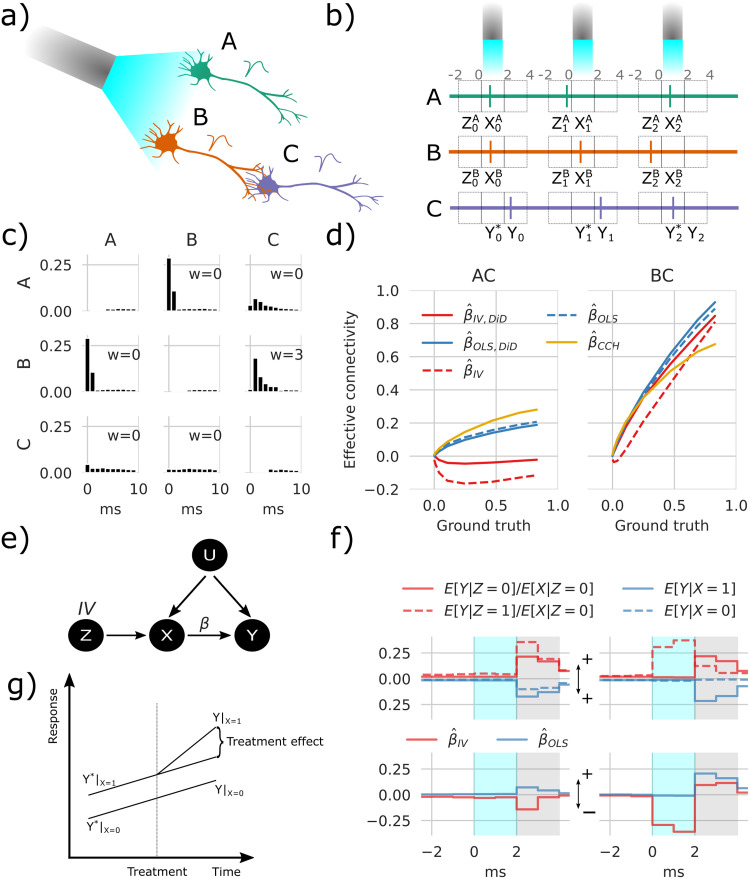
Fig 1. Instrumental variables corrects spurious correlations induced by optogenetic stimulation.
a) Simple network containing three neurons shows stimulation configuration with blue laser light and the connections illustrated by axon touching dendrites. b) For each stimulation pulse, three spike detection windows are placed relative to stimulus onset time, pre, during, and post, which is stored as Z, X, and Y, respectively, where Z and X represent either A or B while Y represents C. c) Cross-correlation histogram (CCH) with the vertical axis showing the conditional expected value E[Mi = 1|shift(Mj, τ) = 1], i, j ∈ {A, B, C}, τ = 0, 1, …, 9 with shifts in timesteps τ. d) Transmission probability estimates as a function of ground truth between AC, and BC. e) Directed acyclic graph (DAG) showing the relations between variables. The OLS method only uses X to estimate Y, which fails because of the confounding factor U; the refractoriness denoted Z affects X without being affected by U and can therefore be used as an IV. f) Conditional expectancies where the true weight = 7 rightmost values in d. The upper panel is mirrored around zero to aid visualization. The estimates in the lower panel represent differences between solid and dashed lines in the upper panel. The shaded gray area depicts the estimation window, and cyan shading indicates the stimulation window, which in this example also depicts DiD reference (Y*). g) A sketch of the intuition behind DiD.

