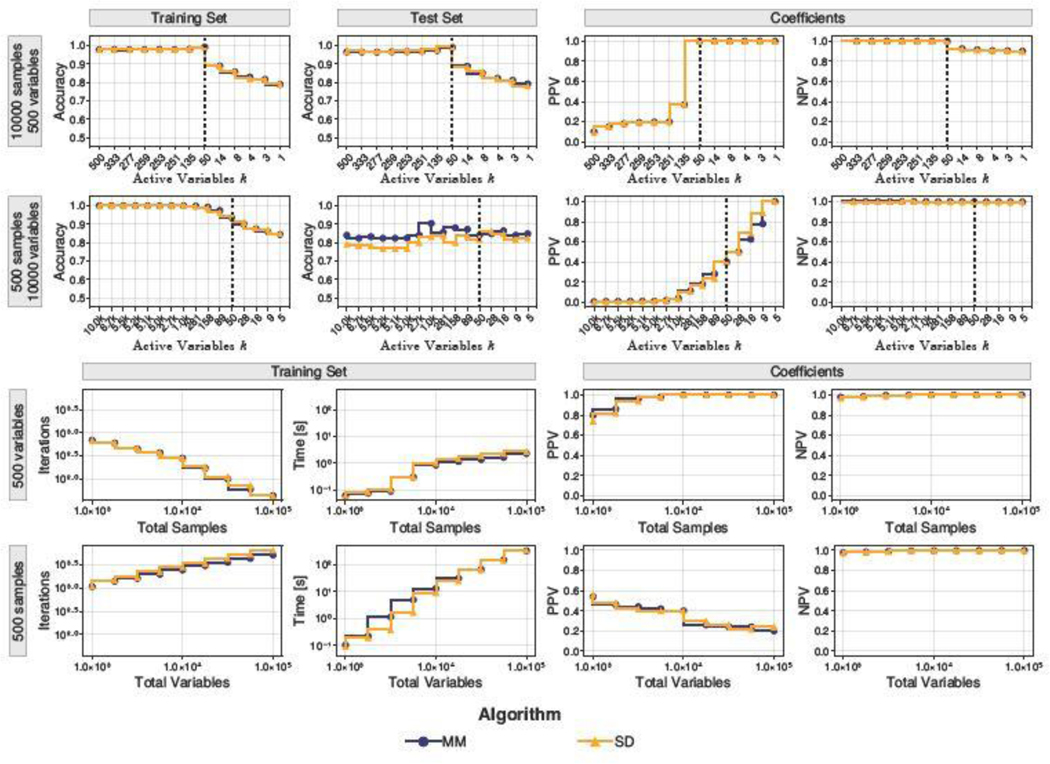
Fig. 2.
Performance characteristics of sparse SVM classifiers fitted using algorithms MM (blue circles) and SD (orange triangles) across various simulated high-dimensional scenarios (row labels). Black vertical lines highlight the number of causal variables used to simulate data. In the bottom two rows, results correspond to the ideal case with k = 50.

