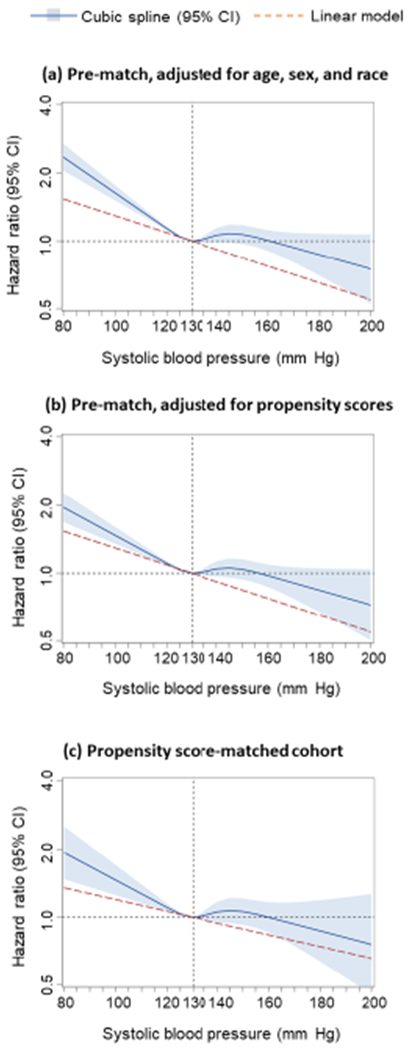
Figure 1: All-Cause Mortality by Systolic Blood Pressure: Restricted Cubic Spline Plots.

In cubic spline analysis, nonlinear relationship between discahrge systolic blood pressure and all-cause mortality was found in (a) 5615 pre-match patients, adjusted for demographics (age, sex, and race), (b) 5615 pre-match patients, adjusted for propensity scores, and (c) 2378 propensity score-matched patients balanced on 58 baseline characteristics (non-linearity p <0.001 for all three analyses). Spline curves excluded patients with systolic blood pressure values <80 mmHg (n=14) and >200 mmHg (n=2; none of the matched patients had systolic blood pressure values outside that range). Solid dark blue lines represent hazard ratios, and light blue shaded areas represent 95% CIs. CI = confidence interval.
