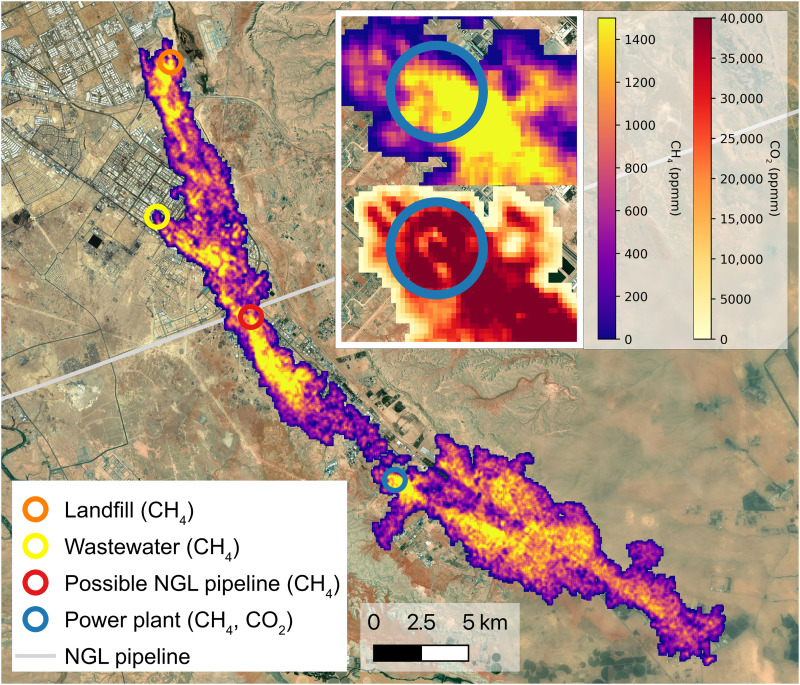
Fig. 3. Source attribution of greenhouse gas plumes in close proximity from different emission sectors.
Emissions from a landfill in Saudi Arabia (28 ± 2 tonnes CH4 hour−1), from a wastewater treatment facility (7 ± 1 tonnes CH4 hour−1), from a power plant (30 ± 2 tonnes CH4 hour−1 and 2032 ± 142 tonnes CO2 hour−1), and potentially from a natural gas pipeline (28 ± 2 tonnes CH4 hour−1). Inlay images show a close up of the power plant source, with colocated methane and carbon dioxide emissions. NGL, natural gas liquids.

