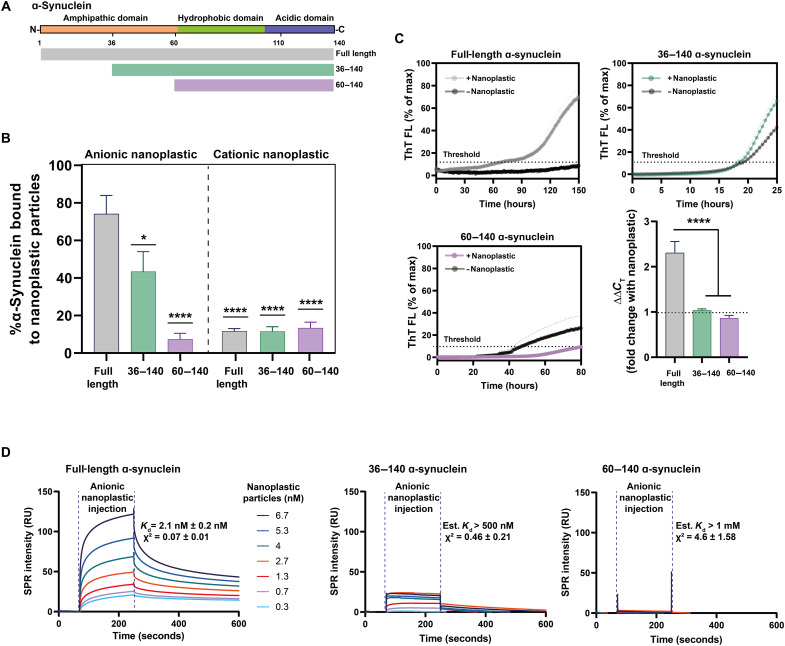
Fig. 3. Anionic nanoplastic tightly binds to the α-synuclein amphipathic domain to initiate fibrillation in vitro.
(A) Domain structure of α-synuclein. Aligned truncated variants in green (36 to 140) and purple (60 to 140) are aligned to full-length protein in gray (1 to 140). (B) Column graphs showing the percentage of full-length or truncated monomeric α-synuclein binding to nanoplastic particles (anionic or cationic). DLS resolves complexes at a stoichiometry of 10:1 protein to nanoplastics. Bars represent mean values of 20 independent acquisitions (SEM shown). *P < 0.01 and ****P < 0.0001, one-way ANOVA with Dunnett’s post hoc test. (C) Spontaneous full-length or truncated α-synuclein aggregation assessed through ThT fluorescence over time, with or without 2.5 nM anionic nanoplastic particles as indicated. Curves represent mean values from quintuplicate independent reactions (SEM shown). Black dashed horizontal line indicates 10% ThT maximum fluorescence used to calculate threshold (CT). Bar graph shows mean fold change from control with nanoplastic addition (ΔΔCT). Means are from quintuplicate independent reactions (SEM shown). ****P < 0.0001 from one-way ANOVA with Tukey’s post hoc test. (D) Representative SPR sensorgrams with full-length α-synuclein (1 to 140, left), truncated 36 to 140 (middle), or 60 to 140 (right), with a range of nanoplastic contaminants in solution. Mean resonance units (RU) in sensorgrams are globally fit to heterogeneous ligand models repeated in triplicate for each protein variant. Average Kd and χ2 values (1 to 140, full-length protein) or estimated values (low-confidence χ2 for the truncated proteins) are shown from three independent array runs (SEM indicated).

